A/B Testing for Your Optimization Strategy
Explore A/B testing.
Learn how to integrate advanced data analysis techniques, get insights and make informed decisions that drive conversions!
By combining the power of data-driven experimentation with advanced analytical techniques, you can revolutionize your optimization strategy and achieve impressive results.
We’ll leverage the synergy between A/B testing and data analytics, showcasing how these two disciplines can work hand in hand to help you make informed decisions.
The world of A/B testing — a simple yet powerful technique that can transform products
In a nutshell, A/B testing involves comparing two different versions of your product (you name it: app, web page, email, ad…) to determine which one performs better.
A/B testing provides practical tips to help you master this game-changing strategy
AB Testing - Common Use
A/B testing, also known as split testing or bucket testing, is a method used to compare two different versions of a product, web page, email, advertisement, or any other marketing material, to determine which one performs better.
The goal is to identify which version is more effective in driving desired outcomes, such as clicks, conversions, or sign-ups.
In an A/B test, the two versions (version A and version B) are shown to different segments of the target audience at random.
The performance of each version is then measured based on predefined metrics or goals, such as conversion rate, click-through rate, or time spent on the page.
After a sufficient amount of data has been collected, the results are analyzed to determine if one version significantly outperforms the other.
If a clear winner emerges, that version can be implemented to improve overall campaign performance.
A/B testing is a valuable tool in digital marketing and user experience design, as it allows the marketing/product and designers to make data-driven decisions and optimize their content, layout, and messaging based on actual user behavior.
AB Testing - The Statistical Side
Regarding the statistical part and data science, A/B testing relies heavily on statistical analysis to draw valid conclusions from the data collected during the test.
Data scientists and statisticians play a crucial role in designing, executing, and interpreting A/B tests.
They ensure that tests are conducted with appropriate sample sizes and follow proper statistical methods to avoid biases or errors.
Statistical concepts like hypothesis testing, confidence intervals, and p-values are essential in determining the significance of the results and the validity of the conclusions drawn from A/B tests.
Data scientists also use various tools and techniques, such as machine learning algorithms and predictive models, to analyze the data and extract meaningful insights that can guide decision-making and optimization.
AB Testing - More Applications
A/B testing can benefit various fields and industries beyond digital marketing and user experience design, as it provides a data-driven approach to decision-making and optimization.
Some areas where A/B testing can be beneficial include:
Product Development: A/B testing can help product managers and developers refine product features, user interfaces, and pricing strategies by understanding user preferences and behavior.
E-commerce: Online retailers can use A/B testing to optimize website elements such as product listings, pricing, promotional offers, and checkout processes to increase sales and customer satisfaction.
Mobile App Development: App developers can use A/B testing to identify the best layouts, designs, and features for their mobile applications, leading to increased engagement and retention.
Human Resources: HR professionals can use A/B testing to optimize job advertisements, recruitment campaigns, and onboarding processes to attract and retain top talent.
Content Creation: Writers, journalists, and content creators can use A/B testing to determine the most effective headlines, article formats, and multimedia elements to increase audience engagement.
That’s enough theory for now. Let’s give it a try to AB Testing with Python and scipy:
AB Testing with Python
Which Free Software can I use to do AB Testing?
Python Code for AB Testing | SciPy 👇
import numpy as np
from scipy.stats import chi2_contingency

# Simulated data: [conversions, non-conversions]
group_a = np.array([120, 880]) # 1000 visitors for group A (12% conversion rate)
group_b = np.array([150, 850]) # 1000 visitors for group B (15% conversion rate)

# Combine the data into a 2x2 contingency table
contingency_table = np.array([group_a, group_b])

# Perform the Chi-squared test
chi2, p_value, _, _ = chi2_contingency(contingency_table)

# Set a significance level (alpha) for the test, e.g., 0.05
alpha = 0.05

# Determine if there is a significant difference in conversion rates
if p_value < alpha:
    print("There is a significant difference in conversion rates between Group A and Group B.")
    print(f"Chi2: {chi2:.2f}, p-value: {p_value:.5f}")
else:
    print("There is no significant difference in conversion rates between Group A and Group B.")
    print(f"Chi2: {chi2:.2f}, p-value: {p_value:.5f}")
This code sets up a simple 2x2 contingency table with simulated data for two groups with different conversion rates.
The chi2_contingency() function from the scipy.stats library is then used to perform a Chi-squared test on the data, comparing the conversion rates between the groups.
The p-value resulting from the test is compared to a pre-defined significance level (alpha) to determine if there is a significant difference in conversion rates between the two groups.
FAQ
Conditional Probability
Yes, conditional probability plays a role in A/B testing, though not always explicitly in the core t-test calculations.
The Bayesian formula is simply:
$$ P(A|B) = \frac{P(B|A) P(A)}{P(B)} $$
where:
- P(A|B) is the posterior probability
- P(B|A) is the likelihood
- P(A) is the prior probability
- P(B) is the marginal likelihood (or evidence)
Here’s how:
Underlying Assumption: A/B testing assumes that the two groups (A and B) are independent and randomly assigned. This means that the probability of a user being in group A or B is independent of any other factors.
Conditional Probability in Analysis:
Analyzing Subgroups: You might want to analyze results conditional on certain user characteristics. For example:
- “What is the conversion rate for users in group A given they are from the United States?”
- “What is the click-through rate for users in group B given they visited the website on a mobile device?”
- This involves calculating conditional probabilities within each group to understand the impact of different factors.
Bayesian Approach to A/B Testing: Bayesian methods explicitly incorporate prior beliefs about the effectiveness of each version.
- You start with a prior probability distribution for the conversion rate of each version.
- As data from the A/B test accumulates, you update these prior probabilities using Bayes’ Theorem to obtain posterior probabilities.
- This allows you to incorporate prior knowledge or expert opinions into the analysis.
In summary:
While the core t-test in A/B testing doesn’t directly involve explicit conditional probability calculations, the concept of conditional probability is relevant when analyzing subgroups or when using Bayesian methods for A/B testing.
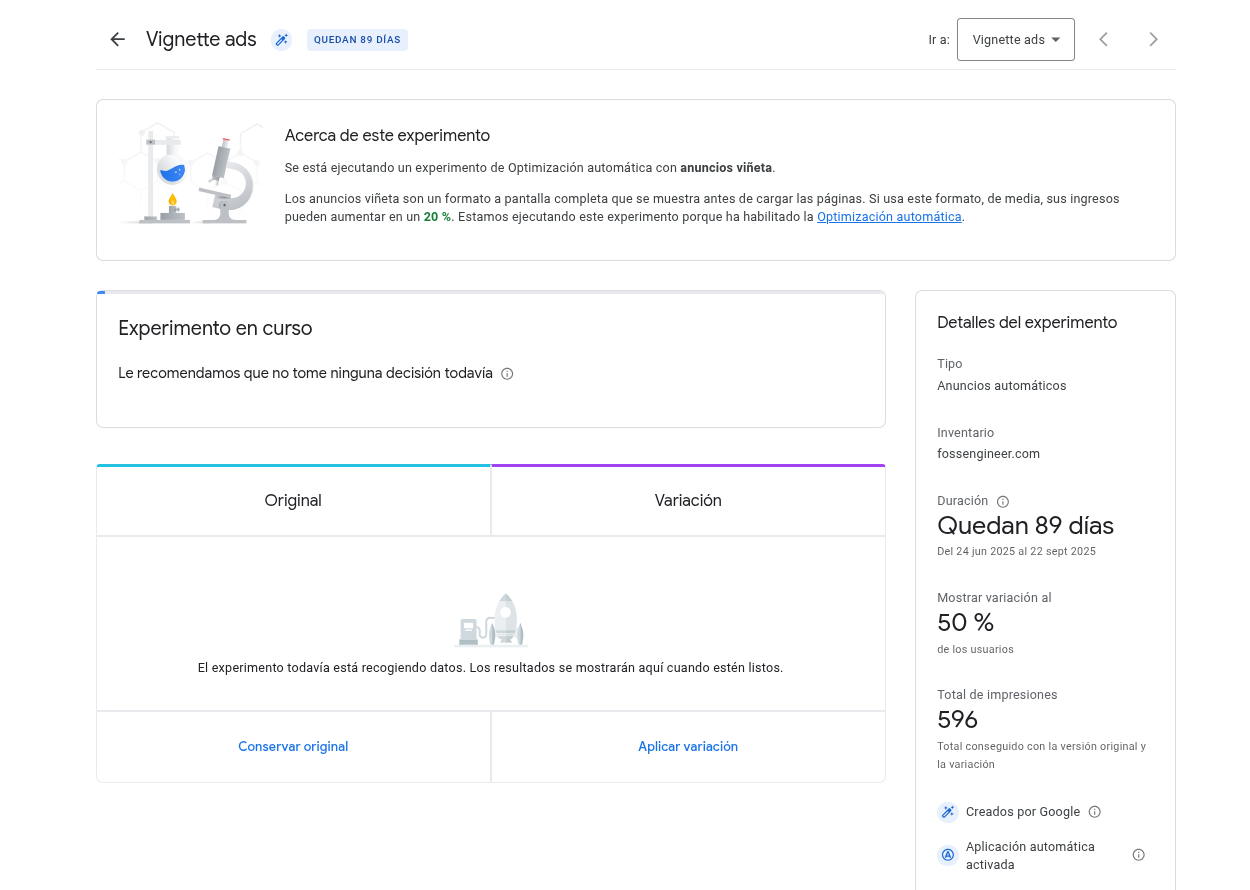
AB with Adsense
If you have ever used adsense or similar platforms, you may have run experiments:
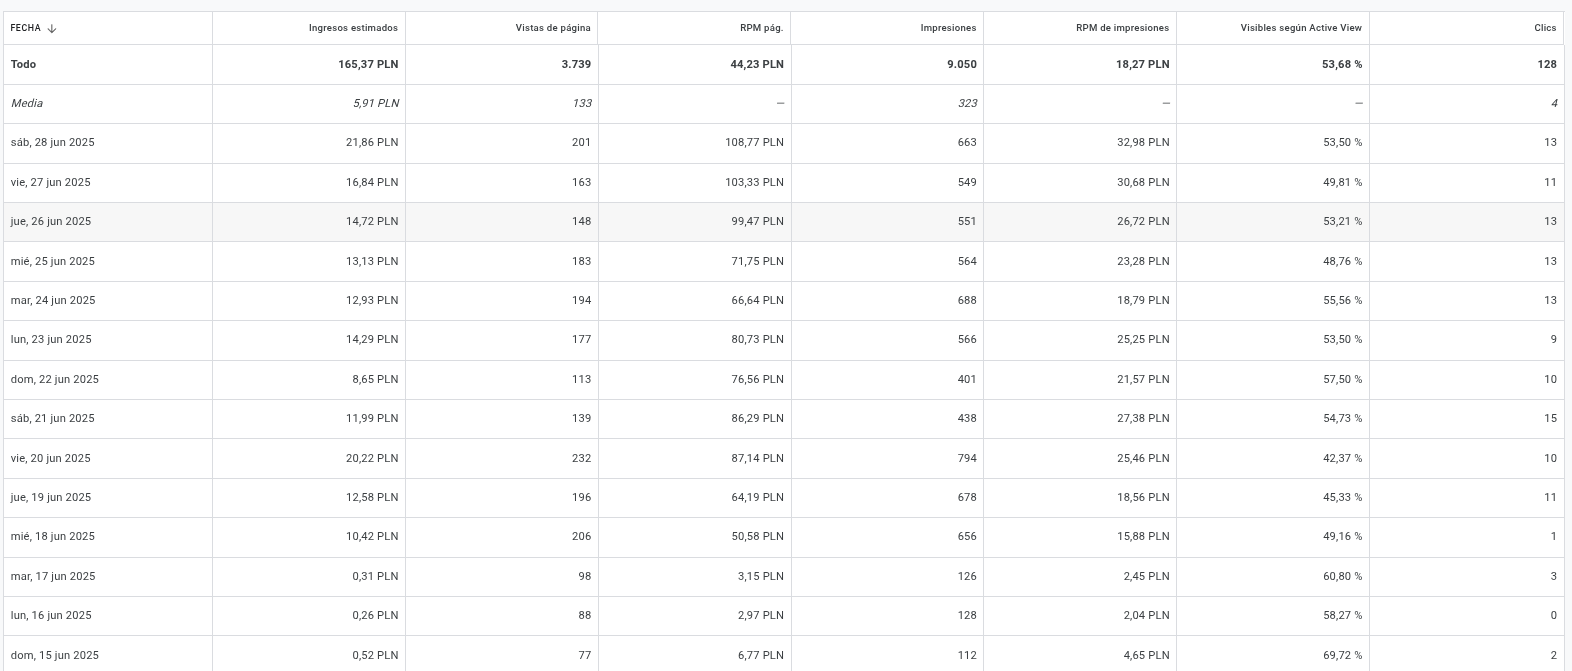
Here’s a breakdown of each metric:
1. FECHA (DATE)
- What it is: This column simply shows the specific day or time period for which the data is being reported. “Todo” means “All” or “Total,” representing the sum for the entire period shown.
2. Ingresos estimados (Estimated Earnings)
- What it is: This is the total estimated revenue you’ve earned from your AdSense ads for the given date or period. It’s an estimate because the final earnings are usually reconciled and finalized later by Google.
- Why it’s important: This is your bottom line! It tells you how much money your website or content is generating from ads.
3. Vistas de página (Page Views)
- What it is: This metric represents the total number of times your pages (with AdSense ads) were viewed. A single user can generate multiple page views.
- Why it’s important: It’s a measure of your website’s traffic. More page views generally mean more opportunities for ads to be seen and clicked.
4. RPM pág (Page RPM - Revenue Per Mille / Thousand Page Views)
- What it is: This is calculated as:
(Estimated Earnings / Page Views) * 1000. It tells you how much you’ve earned for every 1,000 page views your site received. - Why it’s important: This is a crucial metric for understanding your monetization efficiency. A higher Page RPM means you’re earning more money for the same amount of traffic. It helps you compare the performance of different pages, ad placements, or time periods.
5. Impresiones (Impressions)
- What it is: An impression is recorded each time an ad is displayed to a user. This can be slightly different from page views, as a single page might display multiple ads, or some ads might not load if the user scrolls away too quickly.
- Why it’s important: It tells you how many times your ads were actually seen by users. It’s a measure of ad visibility.
6. RPM de impresiones (Impression RPM - Revenue Per Mille / Thousand Impressions)
- What it is: This is calculated as:
(Estimated Earnings / Impressions) * 1000. It tells you how much you’ve earned for every 1,000 ad impressions. - Why it’s important: Similar to Page RPM, this measures the efficiency of your ads per ad unit displayed. It’s a good metric if you want to understand how well your individual ad units are performing.
7. Visibles Segun Active View (Active View Viewable)
- What it is: This is the percentage of ad impressions that were considered “viewable” according to Google’s Active View criteria. An ad is generally considered viewable if at least 50% of its pixels are on screen for at least one continuous second for display ads, or two continuous seconds for video ads.
- Why it’s important: This metric indicates the quality of your ad placements and user engagement. A higher percentage means more of your ads are actually being seen by users, which can positively impact your earnings and attract better advertisers.
8. Clics (Clicks)
- What it is: The total number of times users clicked on your AdSense ads.
- Why it’s important: Clicks are a direct indicator of user engagement with your ads. More clicks generally lead to higher earnings.
Key Takeaways from Your Data:
- Total Earnings (“Todo”): You’ve earned 165.37 PLN over the period shown.
- Traffic: You’ve had 3,739 page views in total.
- Efficiency: Your overall Page RPM is 44.23 PLN, and your Impression RPM is 18.27 PLN.
- Daily Fluctuations: You can see how your earnings, page views, and RPMs vary from day to day.
- Active View: Your Active View Viewability hovers around 50-60%, which is decent but always has room for improvement.
What to Look For and Optimize:
- Trend in Earnings: Are your earnings generally increasing or decreasing over time?
- Page RPM: Aim to increase this! This means your traffic is being monetized more effectively. You can improve it by:
- Optimizing ad placements (where ads appear on your page).
- Improving ad sizes.
- Creating more engaging content that attracts relevant users and higher-paying advertisers.
- Active View Viewable: A higher percentage means your ads are more likely to be seen. Consider:
- Ad placement (are they atf or in easily viewable areas?).
- Page load speed (slow pages mean ads might not load before users scroll away).
- User experience (are users staying on your pages long enough for ads to become viewable?).
- Clics: If clicks are low relative to impressions, it might indicate that ads aren’t relevant to your audience or are not engaging enough.