[Gen-BI] Creating a custom PGSQL Gen-BI BAML Powered Analytics
TL;DR
Is it possible that agents will not only reply a query based on the real content of a database.
But also would provide a proper visualization?
Why are we still building dashboards for one-off questions?
Intro
After getting that pnp D&a with langchain and pgsql ready here.
With a Vibe coded UI Wrapper: done for BAs, here
And having a session for non-tech users to learn to vibe code similar tools.
They got this superpower:

Its time to review some existing generative BI tools available.
And build something.
Existing GenBI Solutions
I have seen couple very interesting ones: that you can selfhost and use for inspiration
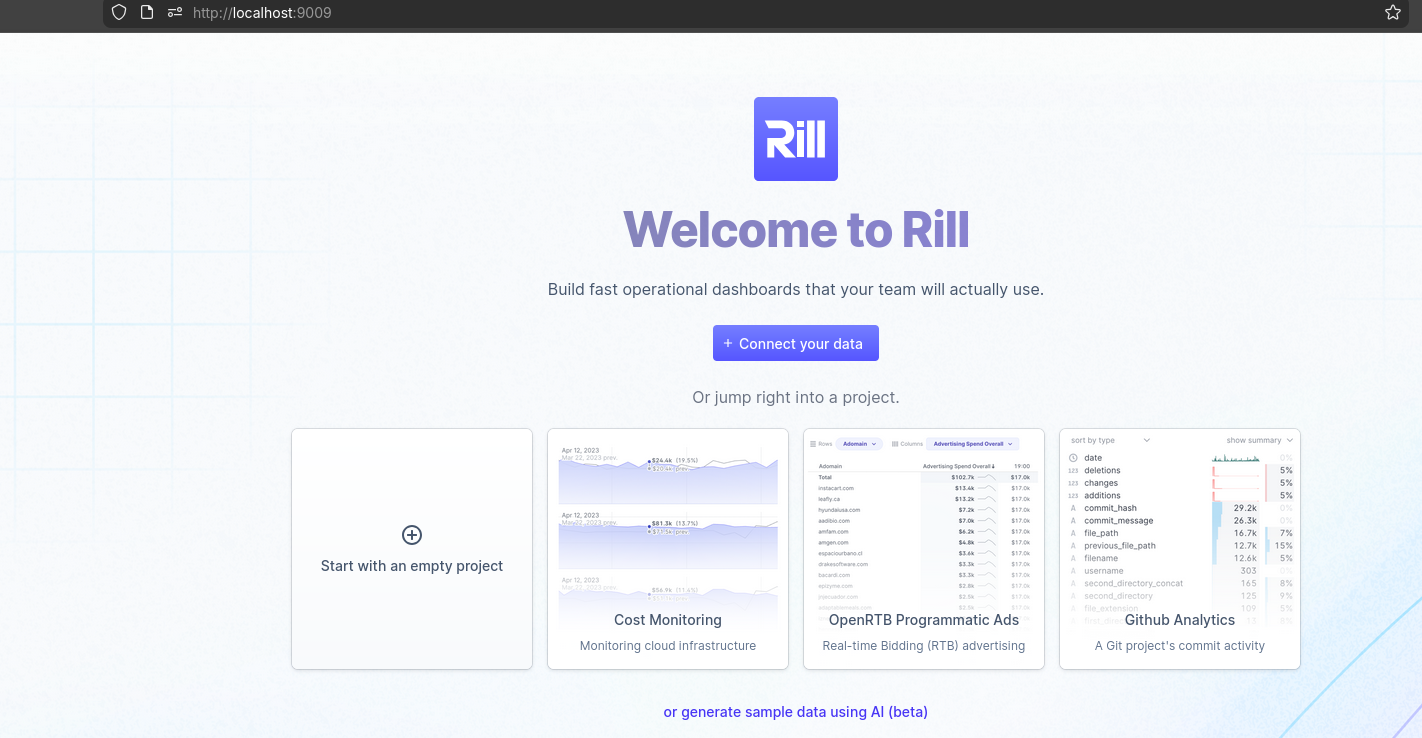
Rill
Go beyond dashboards: with BI-as-code
Rill delivers fast exploratory dashboards.
Rill makes it easy to create and consume metrics by combining a SQL-based data modeler, real-time database, and metrics dashboard into a single product—the fastest path from data lake to dashboard.
A high-performance, AI-native alternative to legacy BI, backed by modern analytical databases.
- https://github.com/rilldata/rill
- https://ui.rilldata.com/demo
- https://www.rilldata.com/pricing and
https://www.rilldata.com/apache-druid - https://docs.rilldata.com/
- With a very interesting https://datatalks.rilldata.com/
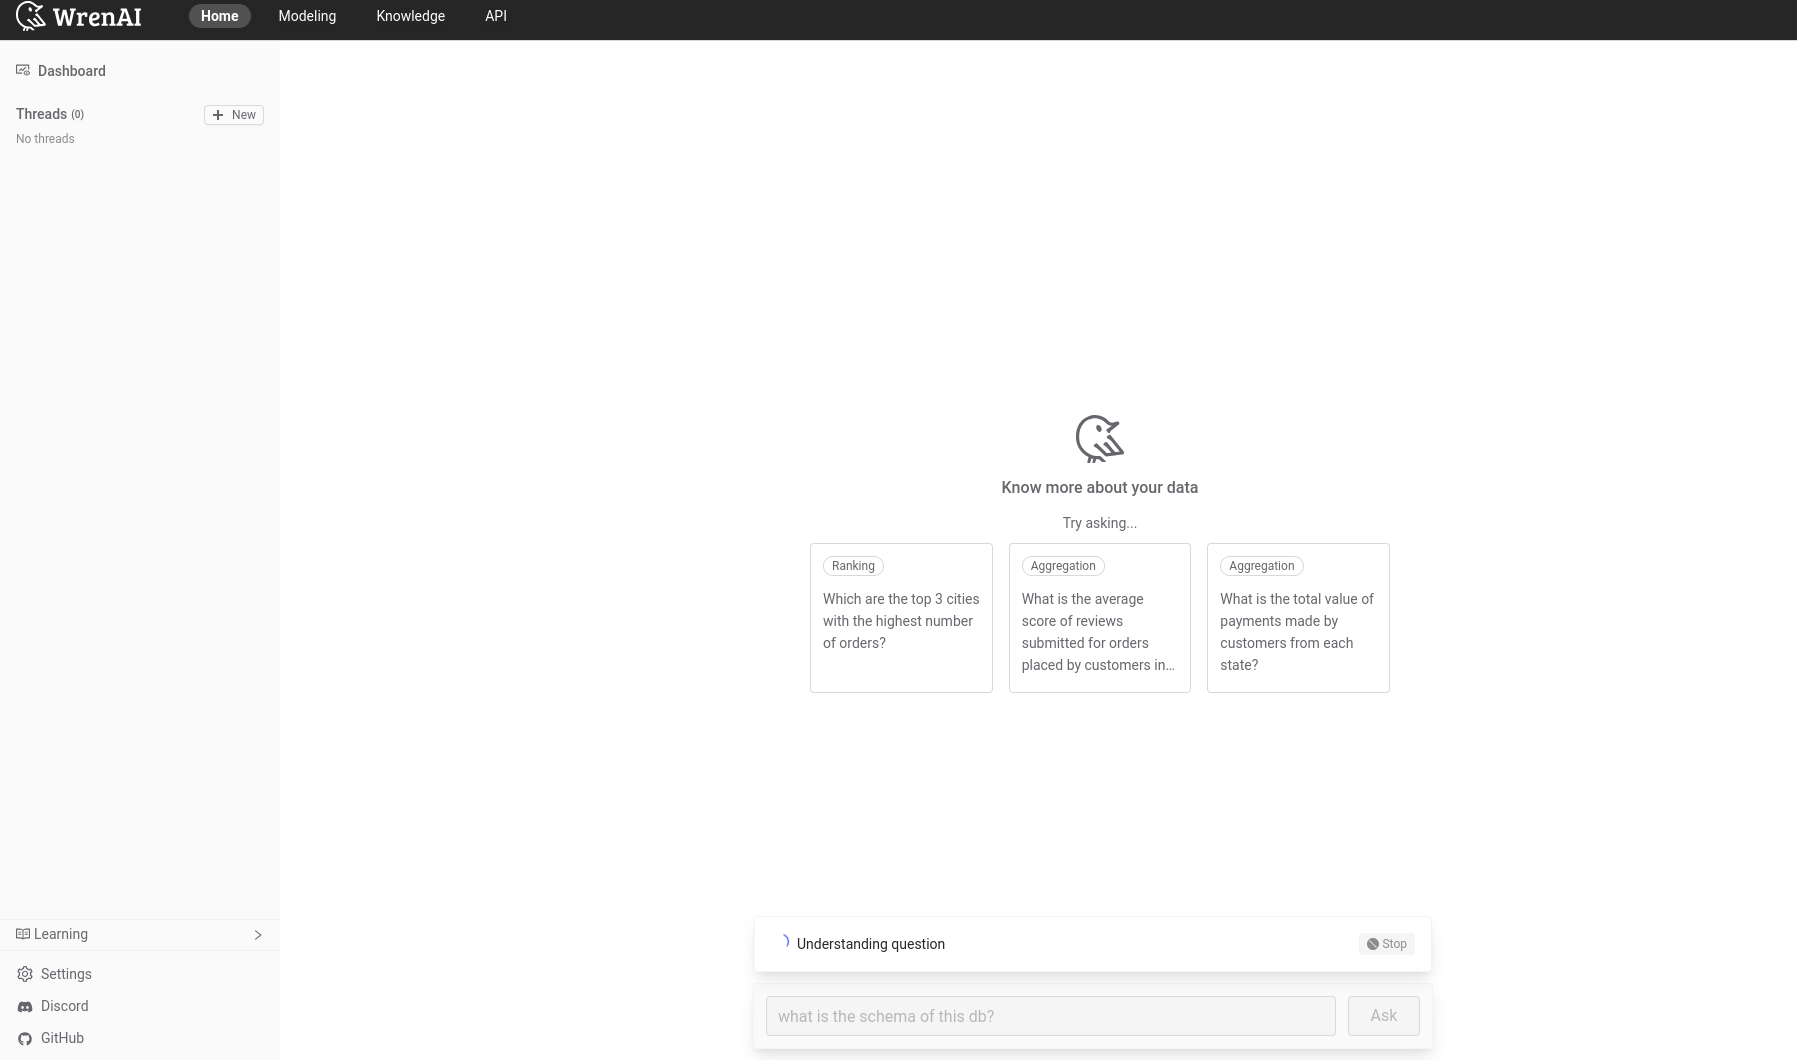
WrenAI
Wren AI - Open-Source GenBI Agent
git clone https://github.com/Canner/WrenAI.git
#https://github.com/JAlcocerT/WrenAI
cd WrenAI/docker
cp .env.example .env
docker-compose up -d
#docker stats
#docker compose down
# sudo docker ps

# CONTAINER ID   IMAGE                                    COMMAND                  CREATED          STATUS                  PORTS                                         NAMES
# da91dea45d04   ghcr.io/canner/wren-ui:0.32.2            "docker-entrypoint.s…"   7 seconds ago    Up 3 seconds            0.0.0.0:3000->3000/tcp, [::]:3000->3000/tcp   wrenai-wren-ui-1
# e0f4caa1ba51   ghcr.io/canner/wren-ai-service:0.29.0    "/app/entrypoint.sh"     8 seconds ago    Up 4 seconds            0.0.0.0:5555->5555/tcp, [::]:5555->5555/tcp   wrenai-wren-ai-service-1
# a8f102d87fb7   ghcr.io/canner/wren-engine:0.22.0        "/__cacert_entrypoin…"   8 seconds ago    Up 4 seconds            7432/tcp, 8080/tcp                            wrenai-wren-engine-1
# f0273f90175a   qdrant/qdrant:v1.11.0                    "./entrypoint.sh"        14 seconds ago   Up 5 seconds            6333-6334/tcp                                 wrenai-qdrant-1
# 7f54128c5212   ghcr.io/canner/wren-engine-ibis:0.22.0   "./entrypoint.sh"        14 seconds ago   Up 5 seconds            8000/tcp, 8888/tcp                            wrenai-ibis-server-1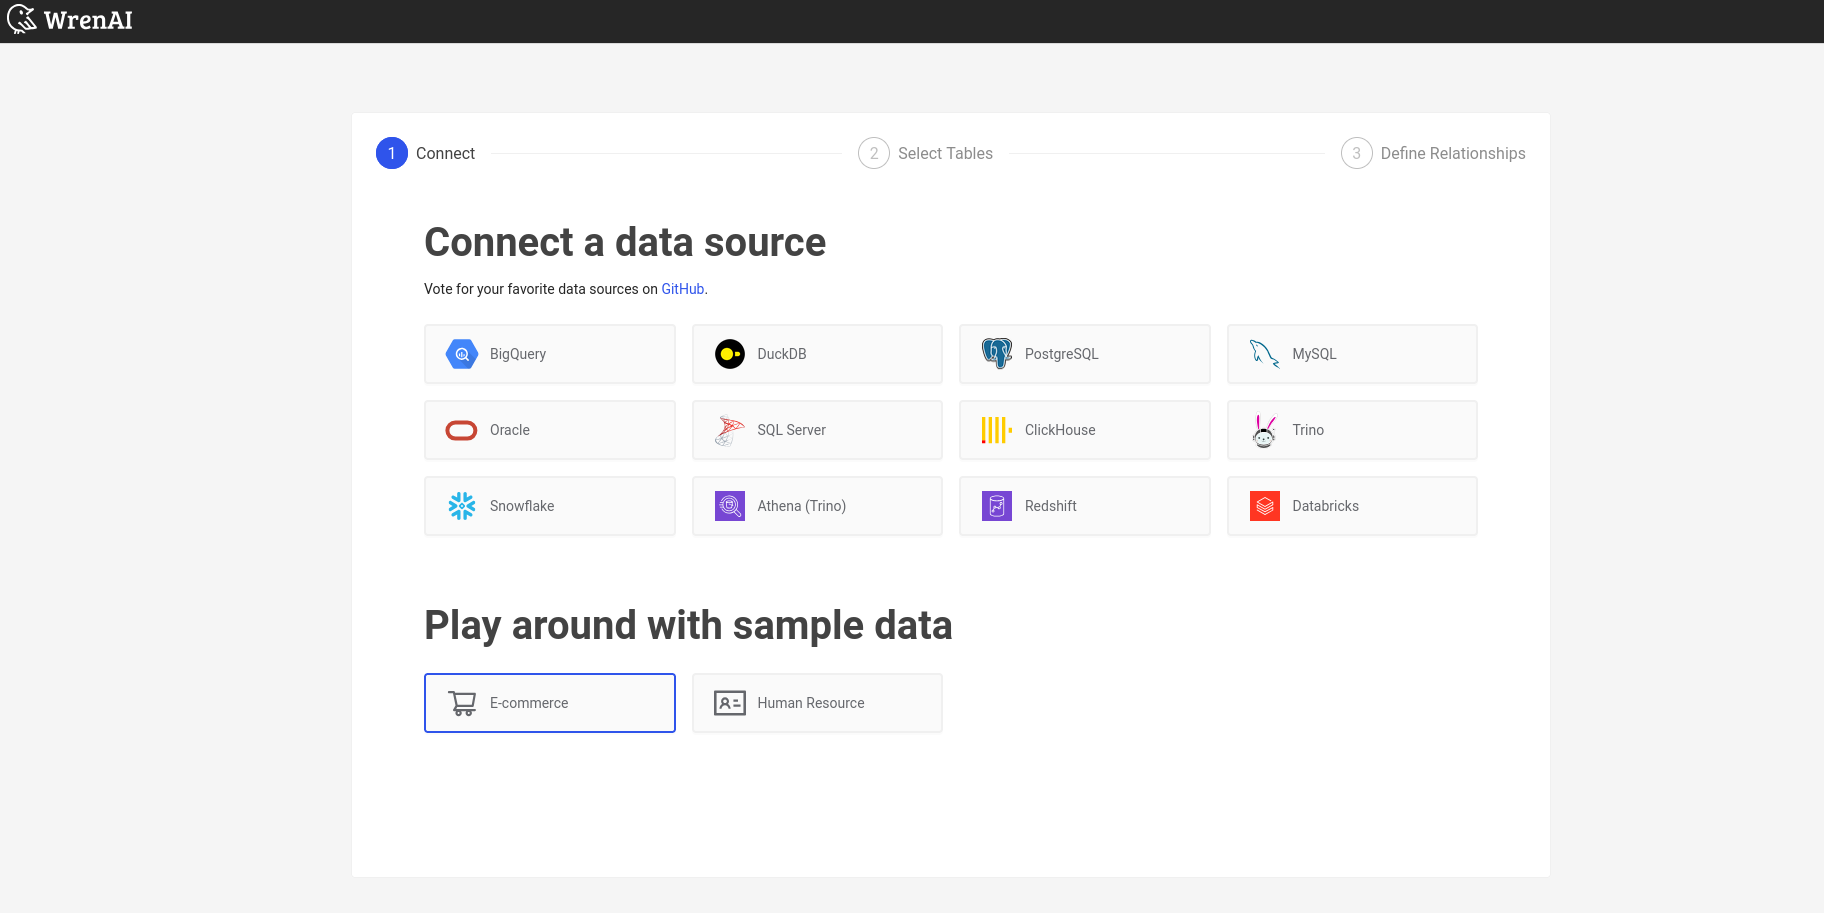
graph LR
    %% Data Sources
    subgraph Sources [Data Sources]
        DB1[(MySQL)]
        DB2[(PostgreSQL)]
        DB3[(BigQuery)]
        SaaS([Slack/SaaS])
    end

    %% Core Architecture Layers
    subgraph Architecture [WrenAI Core Engine]
        DL{Data Layer}
        SL{Semantic Layer}
        AL{Agentic Layer}
        RL{Representation Layer}
    end

    %% Output Deliverables
    subgraph Outputs [Output Applications]
        EA[Embedded Analytics]
        DR[Dashboards & Reports]
        CI[Conversational Interface]
    end

    %% Connections
    Sources --> DL
    DL --> SL
    SL --> AL
    AL --> RL
    RL --> EA
    RL --> DR
    RL --> CI

    %% Styling
    style DL fill:#003366,stroke:#fff,color:#fff
    style SL fill:#1e90ff,stroke:#fff,color:#fff
    style AL fill:#003366,stroke:#fff,color:#fff
    style RL fill:#1e90ff,stroke:#fff,color:#fff
    style Architecture fill:#f9f9f9,stroke-dasharray: 5 5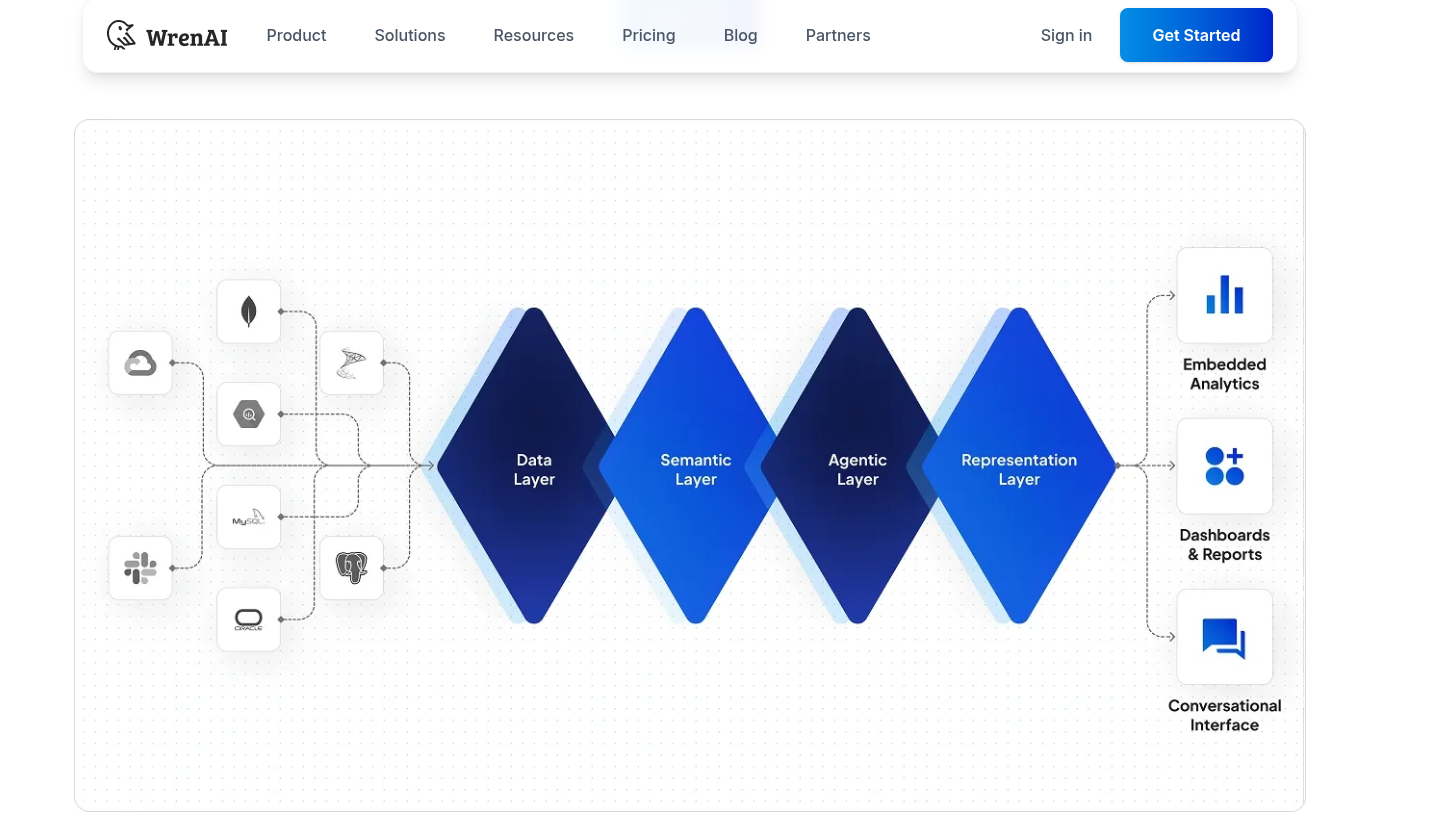
Data modeling adds a logical layer over your original data schema, organizing relationships, semantics, and calculations.
This helps AI align with business logic, retrieve precise data, and generate meaningful insights.
I was impressed by wrenai data stack here.
Which is why these series got started in the first place.
And as you can expect, it works locally:
Pre-Building
But first, some recap on what drove me to this point.
Explored LangChain
Explored few frameworks like llamaindex and pandasAI.
Also tinkered with RAG around CSVs.
And chatted with PDFS.
LLM x Databases
Via langchain is also possible to talk with a database.
Which I rebamped into this pgsql x langchain with few real examples.
Enabled the team
By sharing in couple ways:
- The technical one for big data communities
- The non-tech for business users - With a video proof that this can be done in less than 1h
Building
Time to put something together?
Adding Generative BI to PlugnPlay D&A
Now, time to continue where I left the repository: yes, its going to be the same one
git clone https://github.com/JAlcocerT/langchain-db-uiI got couple of ideas on how to do this.
- To get some graph recommended via function calling.
- To do so via BAML
- https://github.com/boundaryml/baml
- https://jalcocert.github.io/JAlcocerT/using-baml-to-query-a-database/#using-baml
I got to use BAML last year here, while trying to improve the repo to documentation generation tasks
One of their doc example resonated with this: https://baml-examples.vercel.app/examples/book-analyzer
For which they provided the code: https://github.com/BoundaryML/baml-examples/tree/main/nextjs-starter/app/examples/book-analyzer
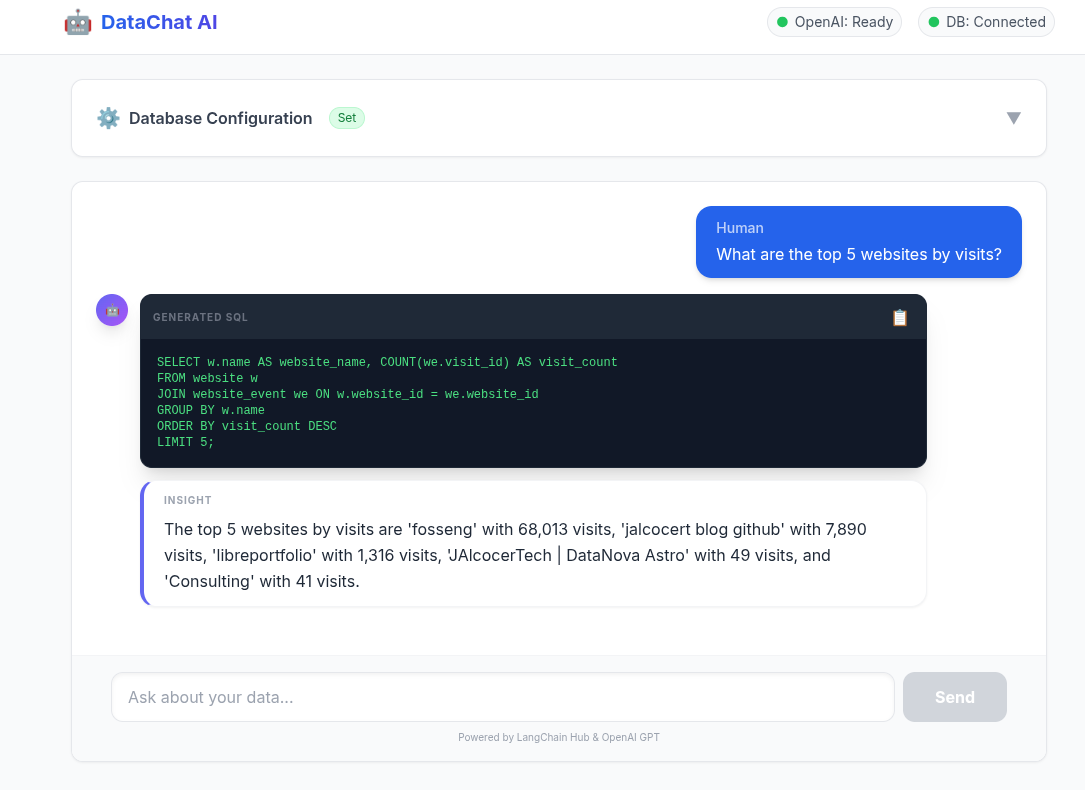
BAML x PGsql x Matplotlib
Moving from z-langchain2baml to z-baml-genbi
You guessed: this has been powered with antigravity.
And it was the rational next step to having baml doing the
- Print the Rationale (Why we did this).
- Print the SQL (What we are running).
- Print the Data Table (The results).
![]()
i have copied the logic to z-baml-genbi
the idea that i want to try now, is that if we could make baml to keep its current output, but to add according to the query and expected result of the table, to propose a kind of chart to display it.
We can assume it will be one of: pie chart, bar chart, time series or unconclusive
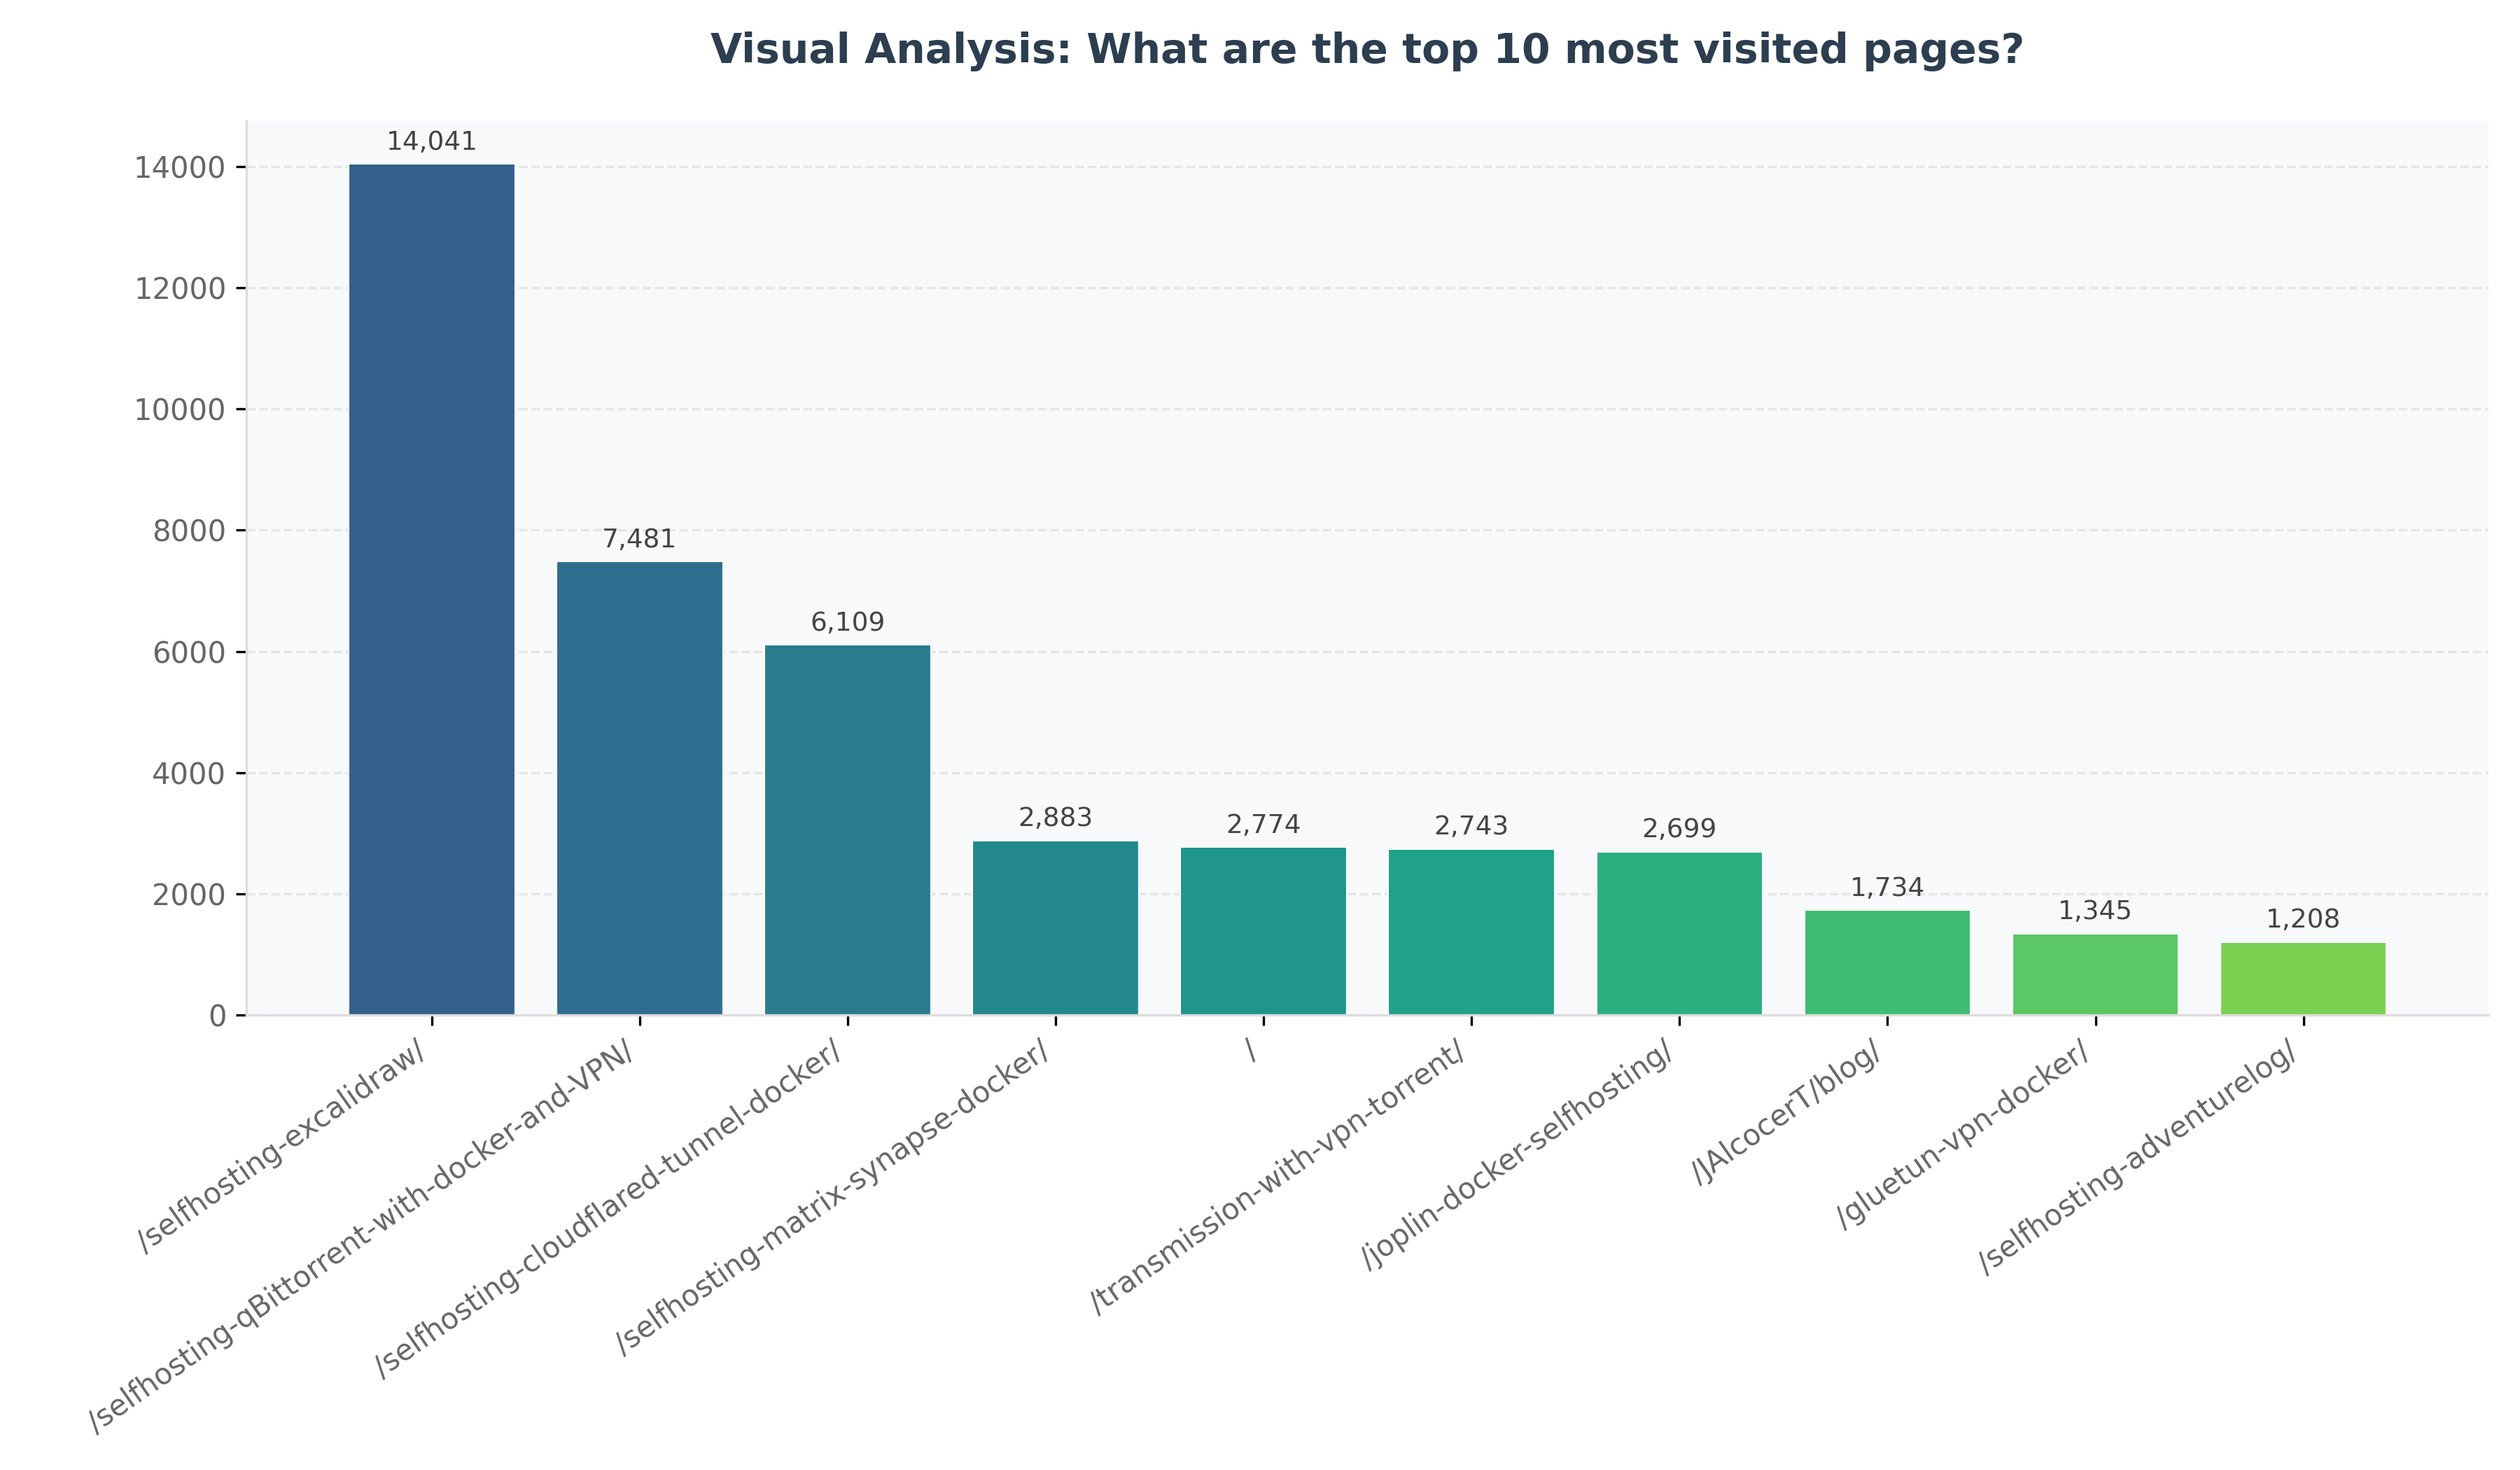
and based on this assesment (we can force it to provide 1 for only one category and 0 for the rest) we will have a python logic that will take the pandas dataframe output from pgsql and create and save a matplotlib chartAs long as you execute this: and you got pg configured
./datachat_venv/bin/baml-cli generate --from z-baml-genbi/baml_src
#pip install matplotlib
python3 z-baml-genbi/baml-genbi.py --db-uri "postgresql://admin:securepassword@localhost:5432/umami_warehouse" --question "What are the top 10 most visited pages?"
You not only get the table reply - you get the result in a recommended graph.
This is the logic flow:
graph LR
    U[User Question] --> S[Python Script]
    S --> |LangChain| DB[(PostgreSQL)]
    DB --> |Schema Context| S
    S --> |Context + Quest| B[BAML]
    B --> |1. Generate SQL| AI[GPT-4o]
    B --> |2. Classify Chart| AI
    AI --> |SqlResult Object| B
    B --> |sql, chartType| S
    S --> |Execute| DB
    DB --> |DataFrame| S
    S --> |Save| CSV[output.csv]
    S --> |Plot| M[Matplotlib]
    M --> |Save| PNG[output_chart.png]
And these are the related concepts:
mindmap
  root((baml-genbi.py))
    BAML (Intelligence)
      SQL Generation
      Visualization Strategy
      Enum: ChartType
      Type-safe Output
    Infrastructure
      LangChain (Schema Extraction)
      SQLAlchemy (DB Connection)
    Data & Viz
      Pandas (Processing)
      Matplotlib (Premium Charting)
    Outputs
      output.csv
      output_chart.png
BAML x PGSQL x Vite x Automatic Charts
The initial setup described at the pnp D&A post, was quite simple and without UI:
graph LR
    A[Question] --> B{LangChain}
    B --> C[Retrieve Relevant Data - SQL Query]
    C --> D[PGSql Database]
    D --> B
    B --> E[LLM Prompt with Data]
    E --> F[LLM OpenAI API]
    F --> G[LLM Response]
    G --> H[User]
As the BAML logic here worked, how about go one step further at Z_PGSQL-GenBI.
All thats coming is thanks to Gemini 3 Flash
that was impressive, can we create now a folder called Z_PGSQL-GenBI

where we will have the current logic of z-baml-gebi, but plugged into the vite app defined at frontend and backend?

we would need to change some parts of that vite app, but the functionality i want to bring is the qna as per current baml version and if the question can be replied with a graph (as categorized by the llm) then it will generate the graph in a cool vite logic
You just need to provide the connection: postgresql+psycopg2://admin:securepassword@localhost:5432/umami_warehouse
Or for the container: postgresql+psycopg2://admin:securepassword@postgres:5432/umami_warehouse
mindmap
  root((Integrated Gen-BI))
    Frontend (React + Vite)
      Recharts (JS Visualization)
      Tailwind CSS v4 (Modern Design)
      Lucide-React (Iconography)
      Framer Motion (Animations)
    Backend (FastAPI)
      BAML Client (AI Orchestration)
      SQLAlchemy (Engine)
      Pandas (Data Wrangling)
      LangChain (Schema Metadata)
    Intelligence (BAML)
      Structure: SqlResult
      Strategy: ChartType Enum
      Model: GPT-4o
    Database
      PostgreSQL
      DuckDB (Experimental)
How does this works?
graph LR
    U[User] -->|Natural Question| F(Vite Frontend)
    F -->|POST /api/ask| B(FastAPI Backend)
    B -->|get_table_info| LC[LangChain]
    LC -->|Metadata| B
    B -->|GenerateSQL| BA[BAML AI]
    BA -->|SQL + Rationale + ChartType| B
    B -->|read_sql| DB[(PostgreSQL)]
    DB -->|DataFrame| B
    B -->|Structured JSON| F
    F -->|State Update| R[Recharts]
R -->|Live Interactive Chart| UOPENAI_API_KEY=your_key
DATABASE_URL=postgresql://admin:securepassword@localhost:5432/umami_warehouseBackend Setup
cd Z_PGSQL-GenBI/backend
pip install -r requirements.txt
python3 main.py
Frontend Setup
cd Z_PGSQL-GenBI/frontend
npm install
npm run dev
This is the first vibe coded version: all you need, to sit less than 1h
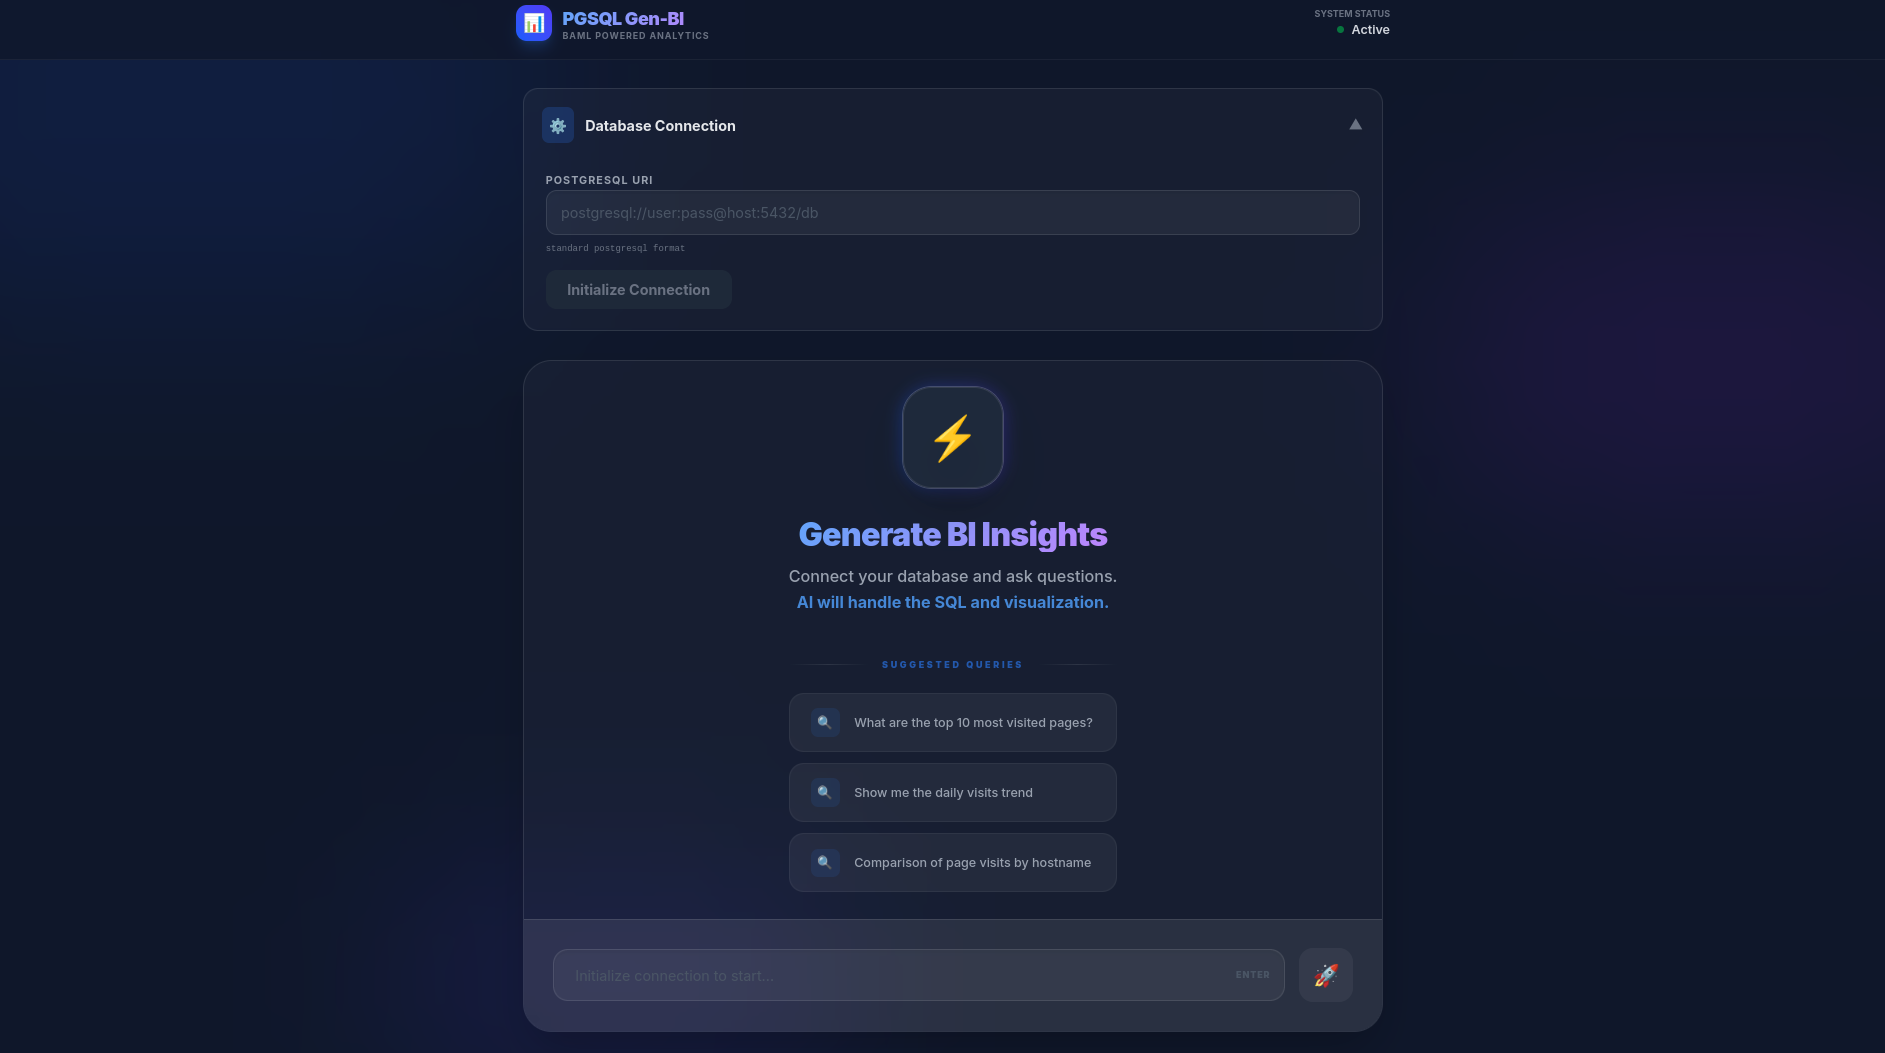
Go to http://localhost:5173/ and enjoy.
Looks cool, doesnt it?
This has been the tech stack.
| Requirement | Specification | Clarification / Decision |
|---|---|---|
| Frontend Framework | React (Vite) | Chosen for low latency and modern developer experience. |
| Styling/UI Library | Tailwind CSS v4 + Framer Motion | Custom “Deep Night” glassmorphism theme for a premium look. |
| Backend/Database | FastAPI + PostgreSQL/DuckDB | High performance with Pydantic validation; SQLAlchemy for DB agnostic engine. |
| AI Intelligence | BAML (GPT-4o) | Type-safe inference for SQL generation and visualization classification. |
| Authentication | Environment Secrets (.env) | Managed via local environment for isolated deployment; ready for JWT integration. |
This project follows a 4-layer architecture for Modern Data Applications:
graph TD
    RL[Representation Layer: React + Recharts]
    AL[Agentic Layer: FastAPI + Python Engine]
    SL[Semantic Layer: BAML Definitions]
    DL[Data Layer: PostgreSQL]

    RL <--> AL
    AL <--> SL
AL <--> DL- DL (Data Layer): The source of truth. In this case, your PostgreSQL instance containing raw Umami events.
- SL (Semantic Layer): Where the magic happens. BAML acts as the translator, turning raw questions into high-level concepts (SQL query, Data Explanation, and Visualization Strategy).
- AL (Agentic Layer): The FastAPI orchestrator. It manages the lifecycle: extracting schema, calling the Semantic Layer, executing against the Data Layer, and packaging the result.
- RL (Representation Layer): The Vite + React interface that turns JSON into interactive BI insights.
And we go:
graph
    subgraph TraditionalBI [Traditional BI: Human-Centric]
        DL1[(DL: Raw Data)] --> SL1[SL: PowerBI Model]
        SL1 --> AL1["AL: Human Analyst (Manual Interpretation)"]
        AL1 --> RL1[RL: Fixed Dashboards]
    end

    subgraph GenBI [Modern Gen-BI: AI-Centric]
        DL2[(DL: Raw Data)] --> SL2[SL: BAML Schema]
        SL2 <--> AL2["AL: Agentic Engine (Automated AI Loop)"]
        AL2 --> RL2[RL: Dynamic JIT Charts]
    end
Conclusions
No 2 companies do D&A in the same way.
But hey, it seem that some parts could be productionized, dont they?

git clone https://github.com/JAlcocerT/langchain-db-ui
cd langchain-db-ui/Z_PGSQL-GenBI
#make help
How many dashboard are built with a lot of effort not to be consumed much in the future and get abandoned?
How many ad-hoc queries get in a queue and its insights are never revealed?
With today’s Gen-BI created solution, you can avoid both scenarios.
In the traditional BI world, insights are expensive and slow.
Z_PGSQL-GenBI is designed to eliminate the “friction” between a business question and a data-driven answer.
If you need it, you know where to get such solution: The goal isn’t to build more dashboards.
The goal is to answer more questions.
Gen-BI is the tool that makes the “Zero-Dashboard” future a reality.
 Consulting Services
 DIY via ebooks
Be smart, turn your Data Layer into a Self-Service Agent.
Related Tech Talk
There is a huge difference between pbi - looker and such custom gen-bi solution.
git clone https://github.com/JAlcocerT/selfhosted-landing
cd y2026-tech-talks/3-genbi-langchain
#npm run dev
Now, more engaging than ever.
FAQ
This diagram outlines a strategic approach to wealth management and lifestyle design, likely originating from a high-performance or entrepreneurial coaching framework.
It emphasizes the transition from focused income generation to disciplined wealth distribution.
graph LR
    %% Main Flow
    A[Business System
Focus] -- "5x Life Expenses" --> B{Allocation Hub}

    %% Distribution Branches
    B -- "x2.5 (50%)" --> C["Keep & Grow Wealth
(Diversify)"]
    B -- "x1.5 (30%)" --> D[Tax]
    B -- "x1.0 (20%)" --> E[Lifestyle]

    %% Styling
    style A fill:#f9f,stroke:#333,stroke-width:2px
    style B fill:#fff,stroke:#333,stroke-dasharray: 5 5
    style C fill:#d4edda,stroke:#28a745,stroke-width:2px
    style D fill:#f8d7da,stroke:#dc3545,stroke-width:1px
    style E fill:#fff3cd,stroke:#ffc107,stroke-width:1px
Here is a breakdown of what this graph suggests and why it is a powerful (though aggressive) financial model:
- The Engine: Business System (Focus)
The starting point is a single “Business System” generating roughly 5x your life expenses. * The “Focus” Tag: This is critical. It suggests that before you worry about complex investing or lifestyle upgrades, you must first build a singular, scalable engine that produces high cash flow.
- The 5x Target: By aiming for 5x your expenses, you create a massive “margin of safety.” Most people live on 1x or 1.2x their income; this model demands you over-earn significantly relative to your needs to fuel the rest of the system.
- The Multiplier Strategy
The blue numbers (, , ) represent the allocation weight relative to your lifestyle:
- Lifestyle (x1): This is your baseline. If your lifestyle costs $10,000/month, that is your “1 unit.”
- Tax (x1.5): This assumes a roughly 30% tax bracket on the total. It treats tax as a mandatory “expense” that is actually larger than your personal lifestyle costs.
- Wealth (x2.5): This is the most aggressive part. It suggests you should be putting 2.5 times more money into investments than you spend on your daily life.
- The Output: The 50/30/20 Split
Once the cash flows through the “Focus” phase, it is split into three buckets:
- 50% Keep & Grow Wealth [Diversify]: Half of every dollar earned goes into assets (stocks, real estate, etc.). This is where the transition from “Active Income” (Business) to “Passive Wealth” happens.
- 30% Tax: A realistic, conservative estimate for high-earning individuals to ensure no legal or cash-flow surprises.
- 20% Lifestyle: This is the “Golden Handcuffs” prevention. By capping lifestyle at 20% of total earnings, you ensure that even if you have a massive year, you don’t inflate your spending to a level that requires the business to run forever.
My Assessment
Strengths:
- Prevents Lifestyle Creep: Most people increase their spending as they earn more. This graph forces spending to stay a fixed, small percentage of the whole.
- Psychological Clarity: It tells you exactly when you are allowed to “diversify.” You don’t play with stocks until the business system is hitting that 5x marker.
- Aggressive Compounding: Putting 50% of gross income into wealth-building assets will lead to financial independence much faster than traditional 10–15% savings rates.
Potential Risks:
- The “Focus” Trap: Staying in “Focus” mode too long can lead to burnout if the 5x target is set too high or if the business is extremely volatile.
- Tax Efficiency: Depending on your jurisdiction, 30% might be too low or too high. Strategic tax planning (corporate structures) might be needed to keep that number from eating into the “Wealth” bucket.
Overall, this is a “Wealth Accelerator” map.
It is designed for someone who wants to work intensely for a decade to never have to work again, rather than someone looking for a slow, 40-year retirement plan.
About Semantic Model
A place with facts, dimensions, joins, measures…the building blocks to describe your data.
| Aspect | Dimensional Modeling | Semantic Modeling (PBI) |
|---|---|---|
| Focus | Efficiency and Structure (Star Schema). | Usability and Business Logic (Logic + Context). |
| Action | Joining tables, defining PKs and FKs. | Refinement: DAX, Renaming, RLS, Formatting. |
| Output | A clean, technical Warehouse schema. | A “Self-Service” model ready for business users. |
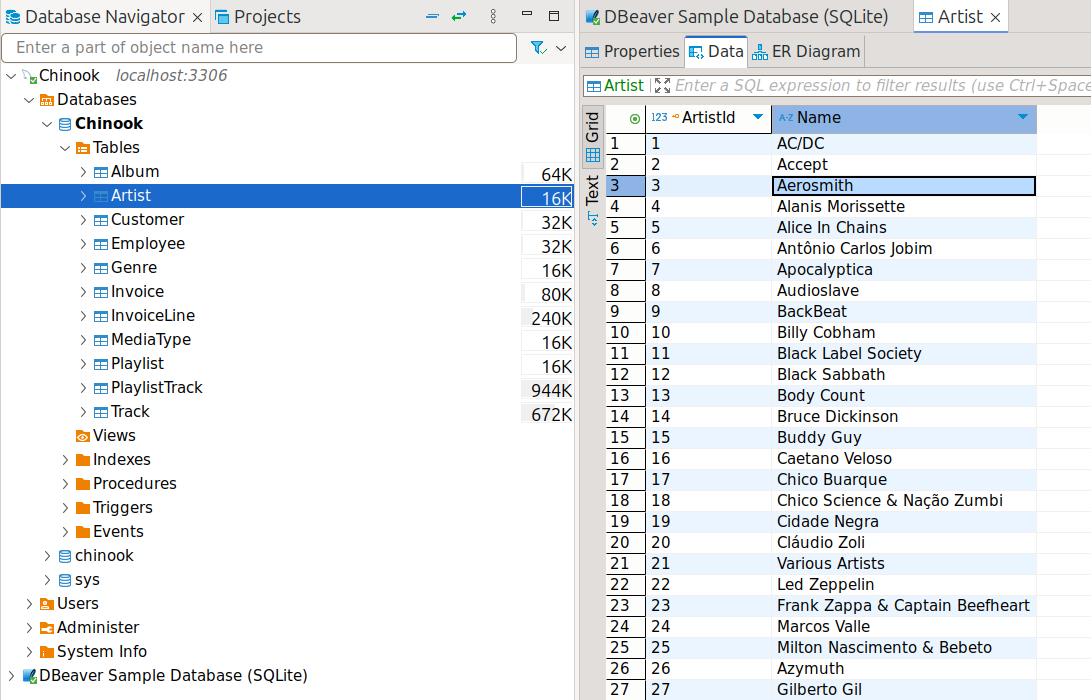
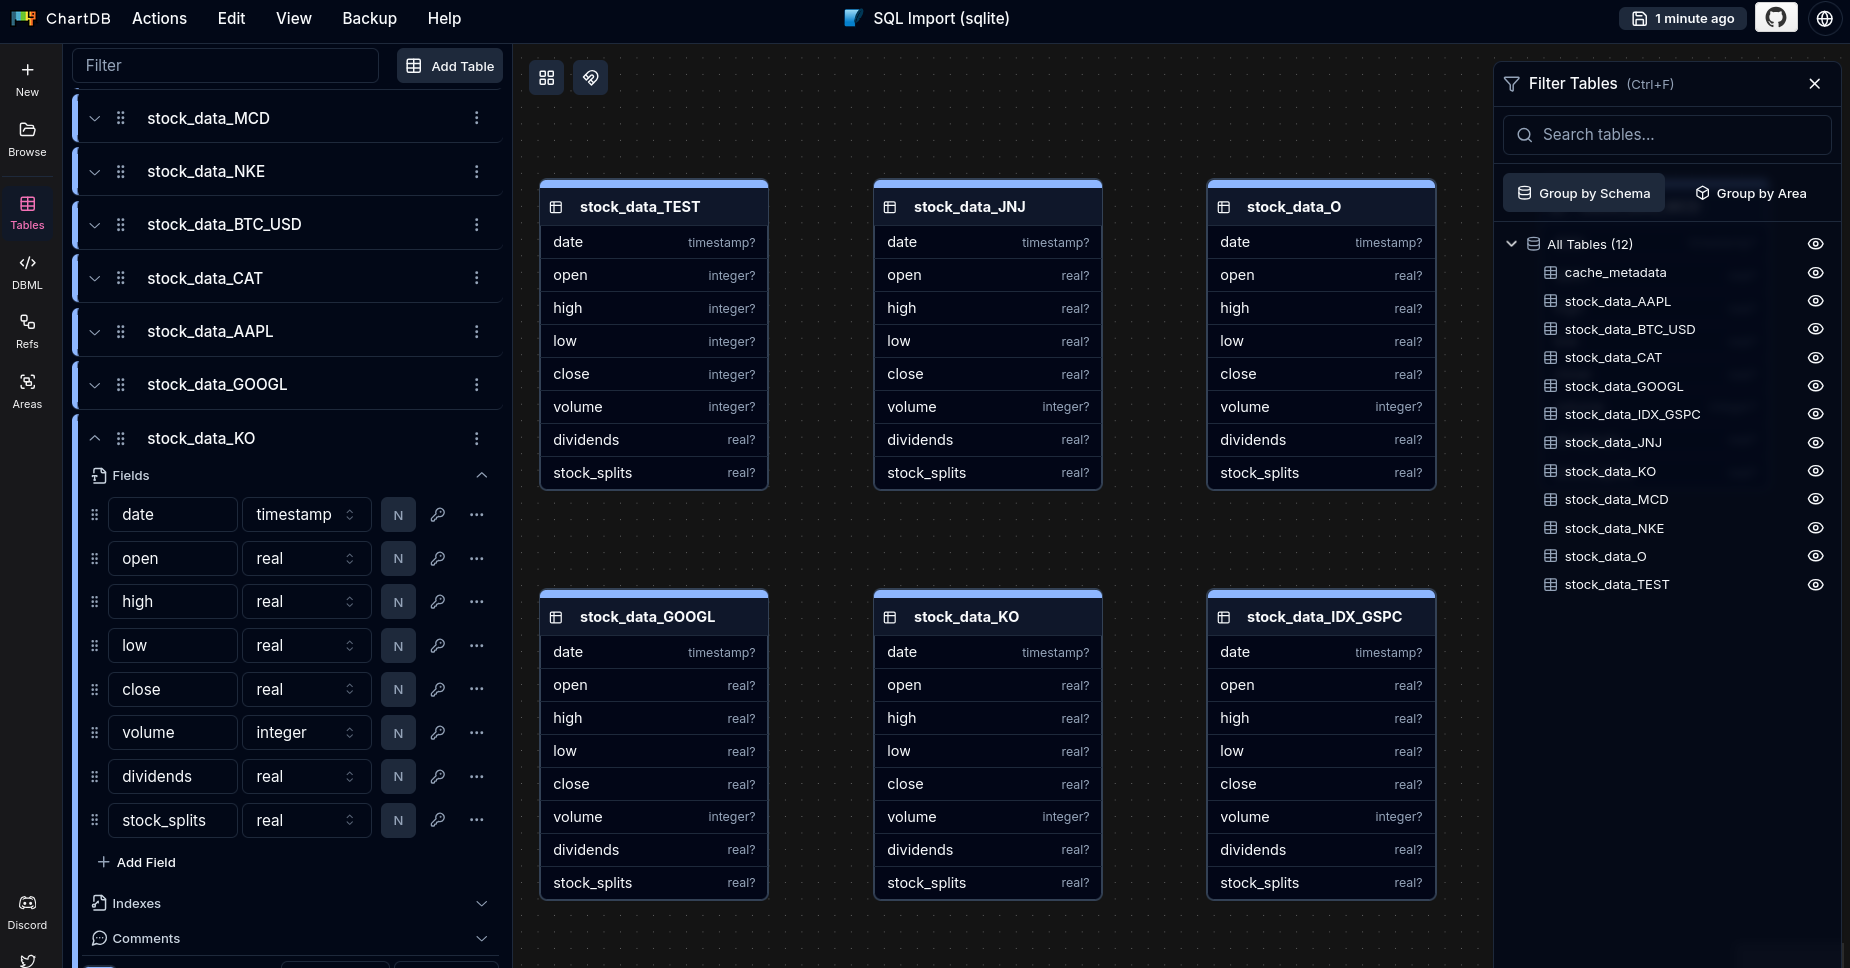
Tools to Interact with DBs
I was covering these in previous post, like
- ChartDB: https://github.com/chartdb/chartdb
WHich I used here
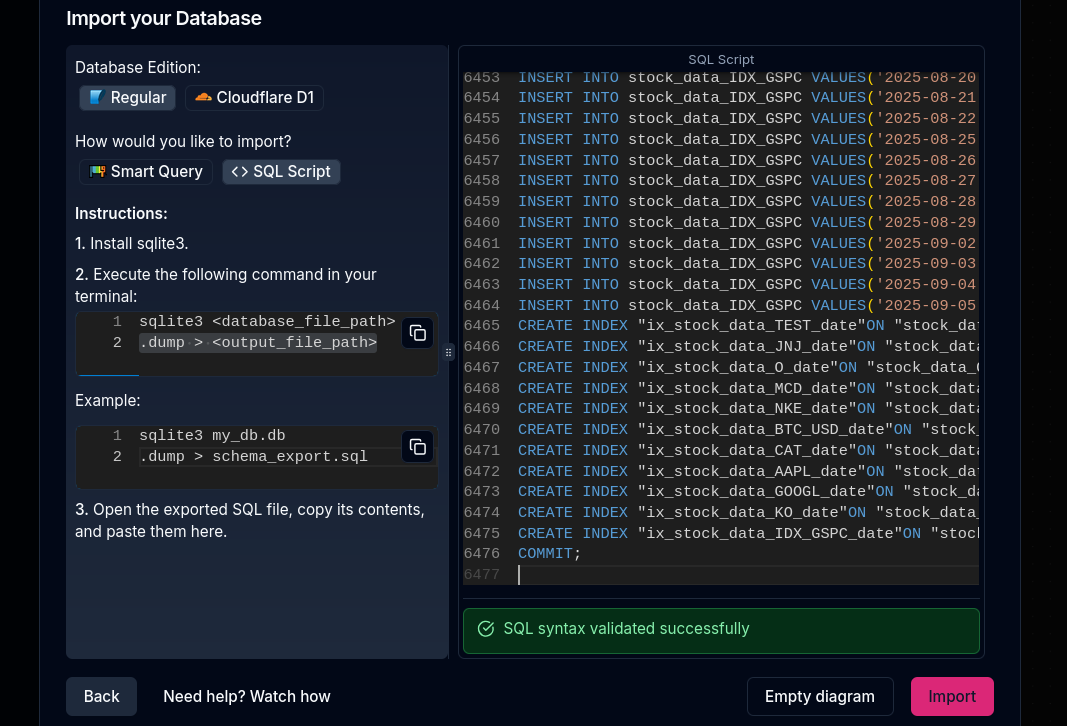
- DBeaver
More Tools to Interact with DBs
Vanna AI (GitHub: vanna-ai/vanna): RAG-based SQL agent with viz. Train on your schema/docs, query in English → SQL + charts. Embed via Streamlit/API. Less semantic layer than Wren.[1][2][3]
MindsDB: ML-integrated text-to-SQL + predictions. Natural language queries → SQL/models/charts. Docker-friendly, broad DB support. More ML-heavy.[1]
DB-GPT: Multi-agent text-to-SQL framework. Complex workflows, AI security. Experimental but powerful for advanced BI.[1]
Chat2DB: Desktop/web SQL client with built-in LLM text-to-SQL + charts. Multi-DB (Postgres/MySQL), no-code dashboards. Closest plug-and-play.[4][5]
| Project | Stars (approx) | Key Strength | Viz/Dashboards | Self-Host | DBs |
|---|---|---|---|---|---|
| Wren AI | 13k [6] | Semantic layer, GenBI reports | ✅ Auto-charts | ✅ Docker | Postgres, BigQuery+ [7] |
| Vanna AI | High [2] | Custom RAG training | ✅ Basic | ✅ Pip/Docker | Any SQL |
| MindsDB | Large | ML predictions | ✅ Integrated | ✅ Docker | Wide |
| DB-GPT | 11k [1] | Multi-agent | Partial | ✅ | SQL/NoSQL |
| Chat2DB | Popular [4] | UI-first client | ✅ Dashboards | ✅ Docker | 10+ [5] |
Quick Starts
- Vanna:
pip install vanna,vn.init(remote='yourdb'), ask “top sales pie”. - MindsDB: Docker compose,
CREATE ML ENGINE, natural queries. - Chat2DB:
docker run chat2db/chat2db, connect DB → chat.
All OSS, align with your Docker/PocketBase.
Vanna/Chat2DB for quickest Wren-like setup; MindsDB if dividends need forecasts.