[Gen-BI] The insights for a profitable Shopify
TL;DR
Building the engine behind DFY D&A services.
+++ About COO and business efficiency
Intro
There are ~2M shopify stores.
There is a common database schema for all of them.
There is a way to do Generative BI to improve a business.
You see what’s this post is all about, right?
If you dont, some people do and build https://www.onesight.ai/pricing
 NEW - Shopify D&A
 GenBI - Vite x PGSQL x BAML Post
PS: I didnt wake up with this idea by chance
We are coming from:
- The Custom GenBI Post with: WrenAI, Rill, and BAML x Vite…
- Querying pgsql via BAML
- PnP D&A with langchain x pgsql
From Rill, I got to know the Revenue Operations RevOps concept: they have an interesting page https://www.brabble.io/speaking
PoC Shopify
So far you can do web audits to shopify owners like https://morecaknit.com.
Plot twist, they wont score 100, but they sell and they dont want to change the website
Get over it.
What these people might want is to do more money with their ecommerce.
Lets build around that.
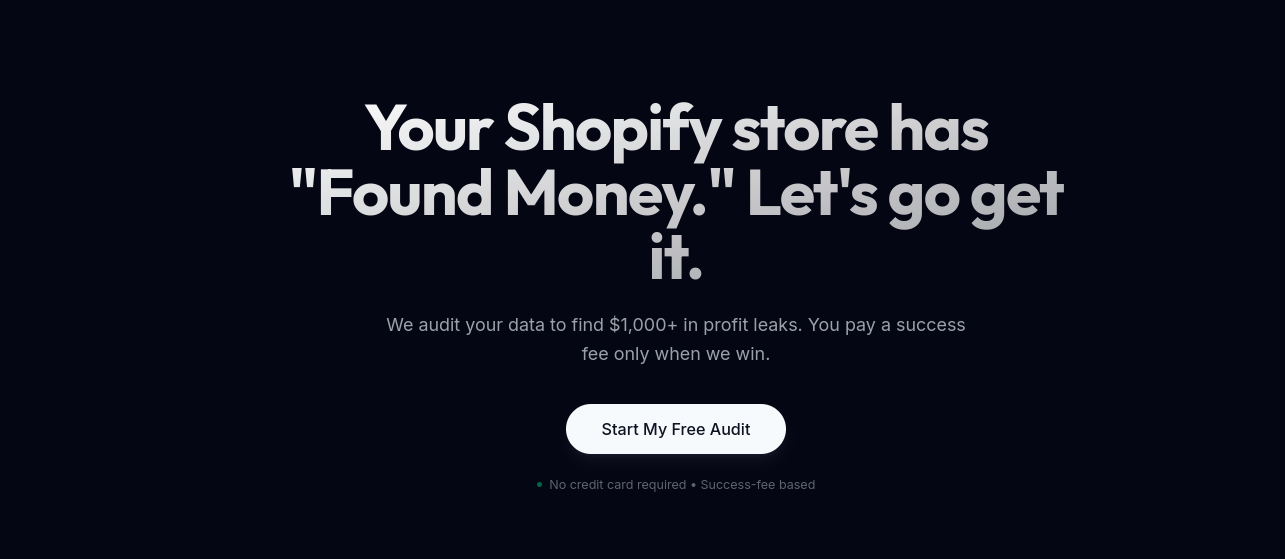
Starting with the Landing
Every project should start with a landing and capturing leads.
Yea…product and no clients does not pay bills.
Creating a Landing for the Shopify Agentic data driven COO 📌
#git init && git add . && git commit -m "Initial commit: Starting shopify poc from langchain baml repo" && gh repo create poc_shopify --private --source=. --remote=origin --push1) when i do make dev it will be exposed to the local network not just localhost?
2) We need the (good looking as per the landing UI/X) t&c and privacy policy, which have to be created from separated markown files
3) can the footer content be also controlled by the site.md copy?
4) and can we do so that when we do npm run dev, I will be able to access it not only via localhost?
5) based on a `docker-compose.prod.yml` with such network and also env variables context?
networks:
cloudflared_tunnel:
external: true
add also the make comand like make-docker-prod-up
also, what could we do so that we use to the max the above the fold section? lets brainstorm here
could we add 2 more examples of real profit covered in the landing?
also where would it make sense to put a video?
i like the concept that zoho has, where initially its an image, but when hit the video loads
should that go below the how it works?
as i dont want to hos tthe video, could we start this youtube video when hit?
I've added the Social Sharing Optimization to the plan! 📱✨
I'll update BaseLayout.astro to include Open Graph and Twitter Card meta tags. This ensures that when you share the link on WhatsApp, Telegram, or Twitter, it will automatically show:Powered by Gemini 3 Flash this time :)
Guess what happened in ~45 minutes?
That I went to termix http://192.168.1.2:8090/ and made shopify-landing-prod:4321 go live via cloudflare tunnels.
git clone https://github.com/JAlcocerT/poc_shopify #genbi.jalcocertech.com
cd poc_shopify/landing
#make help
#docker compose -f docker-compose.prod.yml up -d --build
make prod-up
I placed this at genbi.jalcocertech.com for now.
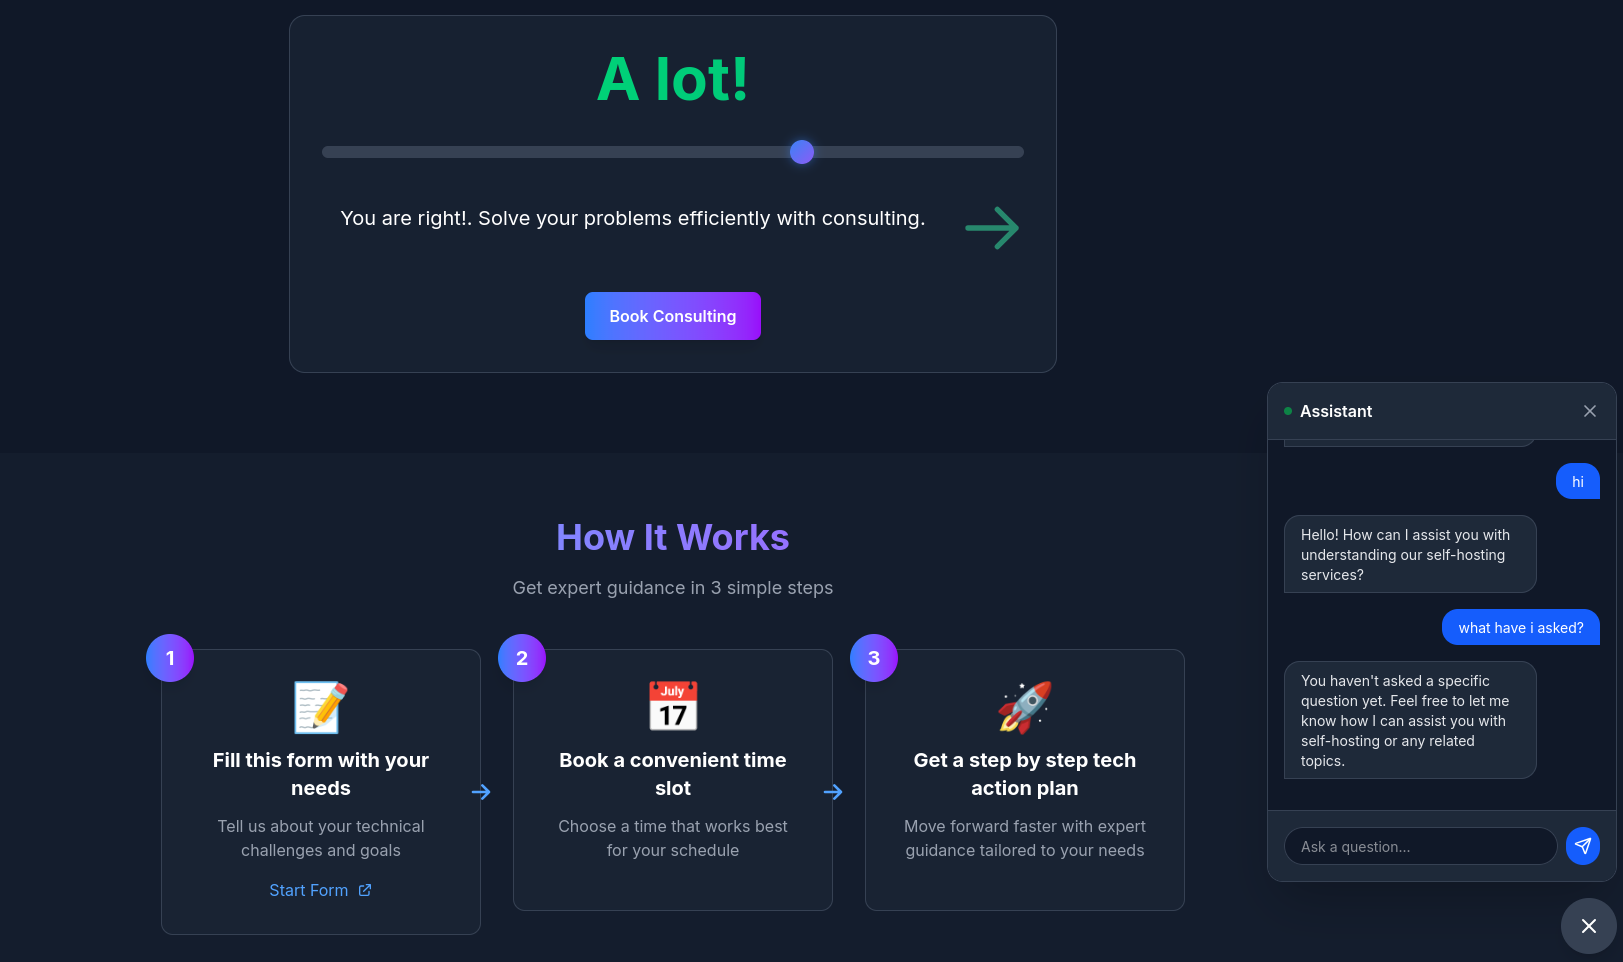
These projects wont only bring the brd, clarifications and dev phases.
The tech stack and how the amazing UI/X forms as well, with its psyc.
The video section was so beautiful.
But also the relation with the value ladder and business strategy.
That I got a place to tweak the copy at /src/content/landing/index.md
| Requirement | Specification | Clarification / Decision |
|---|---|---|
| Frontend Framework | React (Astro/Vite) | Chosen for low latency and modern “Island” architecture. |
| Styling/UI Library | Tailwind CSS v4 + Framer Motion | Custom “Deep Night” glassmorphism theme for a premium look. |
| Authentication | Environment Secrets (.env) | Managed via local environment for isolated deployment. |
| Deployment | Docker | Containerized deployment for easy scaling and isolation. |
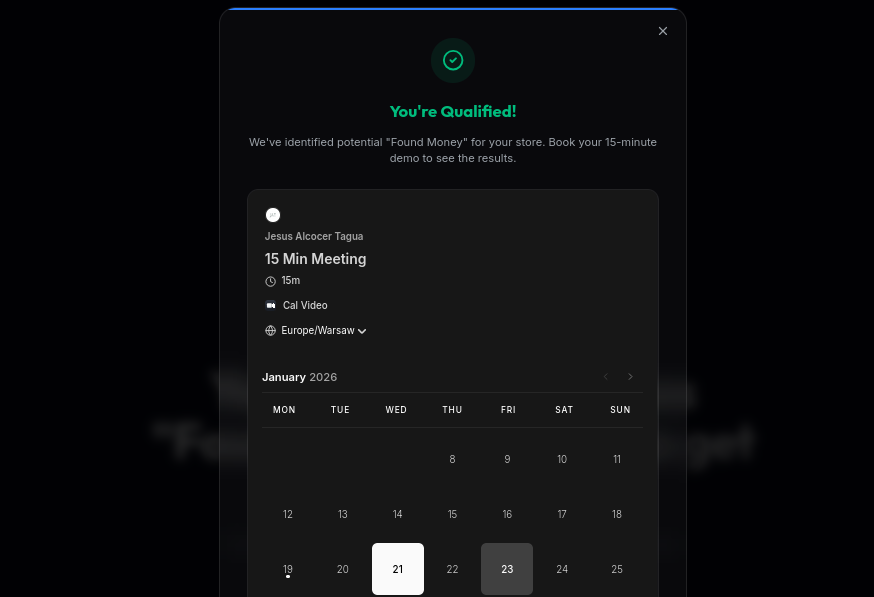
With a custom modern form and integration with a cal meeting, for the qualified ones:
How hard was to create the landing?
You tell me: I was using the BRD trick again
The core analytics
The sauce of this comes from this custom BI with BAMl and vite UI.
Particularly, from its Z_PGSQL-GenBI folder, where Gemini 3.9 impressed my with a Vite UI/X tech stack.
The architecture has 4 layers: Strategic Layer Mapping
graph TD
    RL[Representation Layer: React + Recharts]
    AL[Agentic Layer: FastAPI + Python Engine]
    SL[Semantic Layer: BAML Definitions]
    DL[Data Layer: PostgreSQL]

    RL <--> AL
    AL <--> SL
AL <--> DL| Layer | BAML Gen-BI Architecture | Traditional Role |
|---|---|---|
| DL (Data Layer) | PostgreSQL | Storage of raw event data. |
| SL (Semantic Layer) | BAML Types & Enums | Logic for SQL translation & Chart Strategy. |
| AL (Agentic Layer) | FastAPI + BAML inference | Automated Interpretation (instead of a human analyst). |
| RL (Representation Layer) | React + Recharts | “Just-in-Time” dynamic visualization. |
And the flow details are:
graph LR
    U[User] -->|Natural Question| F(Vite Frontend)
    F -->|POST /api/ask| B(FastAPI Backend)
    B -->|get_table_info| LC[LangChain]
    LC -->|Metadata| B
    B -->|GenerateSQL| BA[BAML AI]
    BA -->|SQL + Rationale + ChartType| B
    B -->|read_sql| DB[(PostgreSQL)]
    DB -->|DataFrame| B
    B -->|Structured JSON| F
    F -->|State Update| R[Recharts]
    R -->|Live Interactive Chart| U
In the traditional BI world, insights are expensive and slow.
Z_PGSQL-GenBI is designed to eliminate the “friction” between a business question and a data-driven answer.
Kind of a niche genbi tool, like these:
About Shopify API
This has been all about the landing so far.
Has it been the coolest if ever ,done'?
Probably.
While the leads are getting hot, Im actually looking to:
https://www.shopify.com/https://shopify.dev/docshttps://apps.shopify.com/https://shopify.dev/changelog
Who is this for?
How to use this PoC with some sense?
Strategic Shift:
Use the Web Audit for SMBs who aren’t ready for data integration yet (Consulting).
Reserve Audit Pro for Shopify owners with >$10k revenue to feed your high-ticket Performance Analytics DFY model.
[!TIP] AuditPro isn’t just a landing page; it’s a Dis/Qualification Filter that protects your time (L3/L4) by ensuring only stores with >$10k revenue (where the 20% success fee is meaningful) get through to your calendar.
Conclusions
There are many efficiencies to be taken of when you run a business.
Having a small team and constrain resources is not an excuse anymore to get your operations improving.
git clone https://github.com/JAlcocerT/poc_shopify
cd poc_shopify/landing
#make help
The landing is here: shopify-landing-prod:4321 which is genbi.jalcocertech.com.
Ready to have an **agentic COO working for you?
 Consulting Services
 DIY via ebooks
With this one, its some kind of…productizing my services.
flowchart LR
    %% --- Styles ---
    classDef free fill:#E8F5E9,stroke:#2E7D32,stroke-width:2px,color:#1B5E20;
    classDef low fill:#FFF9C4,stroke:#FBC02D,stroke-width:2px,color:#FBC02D;
    classDef mid fill:#FFE0B2,stroke:#F57C00,stroke-width:2px,color:#F57C00;
    classDef high fill:#FFCDD2,stroke:#C62828,stroke-width:2px,color:#C62828;
    classDef bridge fill:#E3F2FD,stroke:#1565C0,stroke-width:3px,color:#0D47A1;

    subgraph "Phase 1: Attraction"
        L0("Free Content (Blog/YT/eBooks)"):::free
    end

    subgraph "Phase 2: The Audit Magnets"
        L1_Web("Web/UI Audit 🛡️
(Find UX Leaks)"):::free
        AP_Pro("AuditPro Landing 🚀
(Find Profit Leaks)"):::bridge
    end

    subgraph "Phase 3: Service Tiers"
        L2("DIY Guides ($)"):::low
        L3("Consulting (DWY) $$
(Web Optimization)"):::mid
        L4("Full Service (DFY) $$$
(Data Analytics / Success Fee)"):::high
    end

    %% --- Connections ---
    L0 --> L1_Web
    L0 --> AP_Pro

    L1_Web --> L2
    L1_Web --> L3

    AP_Pro --> L4

    %% Cross-sell
    L3 -.-> |"Upsell"| L4
Are you even having a pricing strategy that works?
Ok, ok.
Thats more for SaaS.
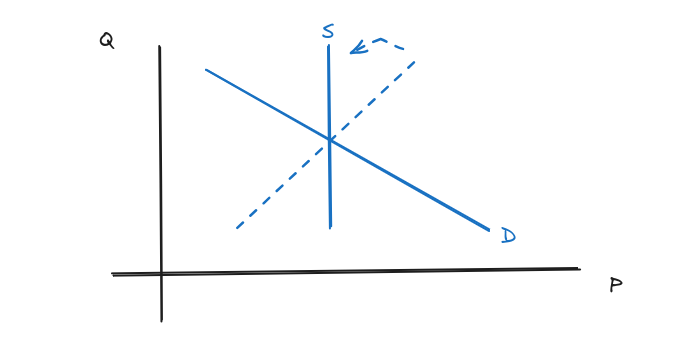
How about this for an ecommerce?
To tie everything together, we’ll look at how different business models prioritize different parts of that formula.
I have added a Shopify E-commerce model (like a brand selling coffee or apparel) to show how it differs from a pure SaaS or a giant like Walmart.
Comparison Table: Strategic Levers & Optimization
Because each game, is a different game:
| Business Model | Primary Lever | Target Metric | Key Point to Optimize |
|---|---|---|---|
| Hermès | Price () | Gross Margin | Scarcity & Desirability: Keeping low to keep and extremely high. |
| P&G | Volume () | Operating Efficiency | Marketing ROI: Ensuring every dollar of ad spend (OpEx) generates maximum to spread fixed factory costs. |
| Walmart | Volume () | Asset Turnover | Logistics Cost: Shaving pennies off COGS through massive supply chain scale to survive on thin margins. |
| Microsoft | Price & Scale | Op. Efficiency | Product R&D: Spending on OpEx today to create software that can scale to millions with near-zero marginal cost. |
| Shopify E-comm | Volume () | Gross Margin | Return Rate & Shipping: Optimizing “Reverse Logistics” and COGS to protect the margin from being eaten by shipping costs. |
| 1-Person SaaS | Efficiency () | Net Margin | LTV/CAC Ratio: Automating everything so that high marketing spend (OpEx) is the only major cost. |
The Shopify E-commerce Example
An e-commerce brand running on Shopify (e.g., selling premium coffee beans) is a hybrid.
Unlike SaaS, it has physical goods (high COGS), and unlike Walmart, it doesn’t have its own trucks (high shipping/OpEx).
The Flow ($100 Bag of Coffee Example)
- Price (): $100.
- Gross Margin (): 60% (). After the coffee beans, packaging, and the “Shopify Fee” (which is a COGS), you have $60 left.
- Operating Efficiency (): 30% (). Here is the struggle:
- You spend $30 on Meta Ads to get one customer (Marketing).
- You spend $12 on shipping and warehouse labor (Fulfillment).
- You have $18 left (EBITDA).
- Your is .
- Interest/Tax: Standard ratios (~0.80).
Net Profit per Unit:
The “Levers” in Action
If you are the COO of that Shopify store, you have three choices to grow your Net Profit ():
- Option 1 (The P Lever): Raise the price of coffee to $110. If stays the same, your jumps, and almost all that extra $10 falls to the bottom line.
- Option 2 (The GM Lever): Find a cheaper bean supplier. This lowers COGS and increases the “survival rate” of your revenue.
- Option 3 (The OE Lever): Improve your email marketing so customers buy twice (Retention). This increases without paying for a new ad (), making your Operating Efficiency skyrocket.
Summary: The COO’s Dashboard
Every business is just a different configuration of the same formula.
- High-margin businesses (SaaS, Hermes) focus on Protecting the Filter (Price/Brand).
- Low-margin businesses (Walmart, Shopify) focus on Increasing the Flow (Volume/Speed).
Every department, is mapped to a specific variable in the fulls tack formula.
graph LR
    %% Top Line Section
    subgraph TopLine ["TOP LINE (Growth & Strategy)"]
        P[Price]
        V[Volume]
        P & V --> REV[Total Revenue]
    end

    %% Internal Drains
    subgraph Drains ["INTERNAL DRAINS (Efficiency)"]
        COGS[[COGS: Factory/Product Costs]]
        OPEX[[OpEx: Marketing/Sales/Admin]]
        INT[[Interest: Financial Debt]]
        TAX[[Taxes: Legal/Gov]]
    end

    %% Bottom Line Section
    subgraph BottomLine ["BOTTOM LINE (Profitability)"]
        NP[Net Profit]
    end

    %% The Flow
    REV -->|Minus| COGS
    COGS -->|Equals| GP[Gross Profit]
    GP -->|Minus| OPEX
    OPEX -->|Equals| EBITDA[EBITDA / Op Profit]
    EBITDA -->|Minus| INT
    INT -->|Minus| TAX
    TAX -->|Equals| NP

    %% Drivers
    MktRef[Product Refinement] -.->|Boosts| P
    AdSpend[Ad Spend/Sales] -.->|Boosts| V
    OpsEff[COO Optimization] -.->|Shrinks| COGS
    Auto[Automation] -.->|Shrinks| OPEX
This final mapping connects the abstract math to the living, breathing departments of a company.
It shows exactly which “lever” each team is responsible for in the master formula.
The Master Cheat Sheet: Department vs. Variable
| Variable | Department(s) Responsible | What they do to optimize the formula |
|---|---|---|
| ** (Price)** | Product / R&D | Build features that make the product “unmissable” (allowing for higher prices). |
| Brand Marketing | Create the “aura” of prestige so customers pay a premium (Hermès style). | |
| ** (Volume)** | Growth Marketing | Spend on ads and SEO to bring traffic to the “top of the funnel.” |
| Sales | Convert leads into paying customers to ensure the “flow” is high. | |
| ** (Gross Margin)** | Factory / Production | Reduce scrap material and labor time per unit. |
| Procurement | Negotiate better deals with raw material suppliers to lower COGS. | |
| ** (Op. Efficiency)** | COO / Operations | Streamline the supply chain and automate fulfillment. |
| HR / Admin | Manage “corporate bloat” (ensure headcount doesn’t grow faster than revenue). | |
| ** (Interest Burden)** | Finance / CFO | Refinance debt at lower rates or pay off loans to stop profit leakage to banks. |
| ** (Tax Burden)** | Tax / Legal | Use legal tax credits, R&D incentives, and global structures to keep more profit. |
Where does the “Indie Hacker” fit?
The Indie Hacker (the 1-person SaaS or solo-founder) is a unique configuration because one person is every department. Their strategy is usually “High-Margin / Low-Friction.”
The Indie Hacker Strategy: Protecting the Filter
Like Hermès or Microsoft, the Indie Hacker lives and dies by Protecting the Filter ( and ).
- Eliminating the Drains: They have no HR or Admin costs. Because they don’t have a factory, their is naturally high (~90%).
- The “Leverage” Focus: Instead of hiring people to increase Volume (), they use Code and Content.
- If they want more , they build a viral feature (Product/R&D).
- If they want better , they use AI to handle customer support instead of a human.
In the “Flow vs. Filter” world: The Indie Hacker is almost always a Filter business. They don’t have the logistics power to compete with the Flow (Walmart). They succeed by finding a niche where they can charge a high for a specialized product with zero production costs.
Summary of the “Business Configurations”
| Strategy | Focus Variable | Primary Goal |
|---|---|---|
| High-Margin (Filter) | Price () | Make the product so good/rare that the “Filter” stays wide open. |
| Low-Margin (Flow) | Volume () | Force so much water (Revenue) through the funnel that even a “Tight Filter” yields a lot of profit. |
| Indie Hacker (Efficiency) | Op. Efficiency () | Keep the “Internal Drains” at zero so every dollar of revenue stays in their pocket. |
Final “CEO Decision” Tip
Whenever you are faced with a business problem, ask: “Which letter in the formula am I trying to fix?”
- If you hire a new salesperson, you are betting on ****.
- If you buy a new robot for the factory, you are betting on ****.
- If you raise your monthly subscription price, you are betting on ****.
Would you like me to create a “Sensitivity Table” that shows exactly how a 1% improvement in each of these variables impacts the final Net Profit?
FAQ
Whats a COO?
There are many unknowns behind executive decisions on a business:
But just understand that the operations is part of them.
How do you plan to grow, how do you plan to optimize?
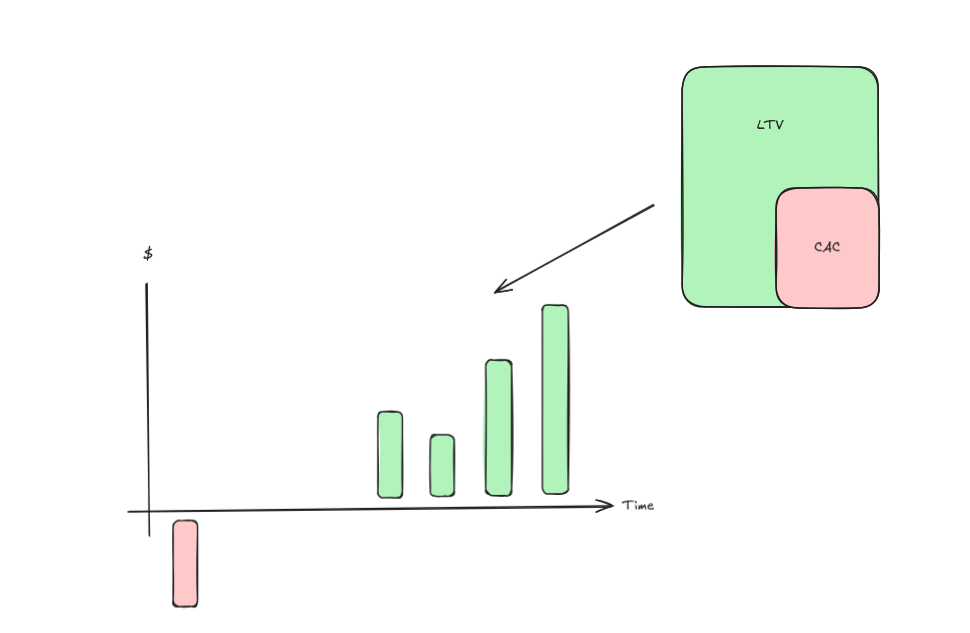
graph TD
    subgraph Metrics [Unit Economics Dashboard]
        direction TB
        LTV_BOX[LTV
Lifetime Value]
        CAC_BOX[CAC
Acq. Cost]
        Ratio{3:1 Ratio}
    end

    subgraph Timeline [Payback Period Tracking]
        T0[Month 0: -CAC] --> T1[Month 3: Recovery]
        T1 --> T2[Month 6: Breakeven]
        T2 --> T3[Month 12+: Profit/LTV]
    end

    %% Data Flow
    Metrics --- Timeline

    %% Styling to match your hand-drawn image
    style LTV_BOX fill:#bbf7d0,stroke:#166534,stroke-width:2px
    style CAC_BOX fill:#fecaca,stroke:#991b1b,stroke-width:2px
    style T0 fill:#fecaca,stroke:#991b1b
    style T1 fill:#bbf7d0,stroke:#166534
    style T2 fill:#bbf7d0,stroke:#166534
    style T3 fill:#bbf7d0,stroke:#166534,stroke-dasharray: 5 5
mindmap
root((Net Profit))
Gross Margin
Price Power
Volume / Scale
Fixed Cost Absorption
Factory Efficiency
Material Yield / Waste
Direct Labor Productivity
Supply Chain
Logistics / Freight
Operating Efficiency
Marketing Efficiency
CAC - Customer Acquisition Cost
Brand Equity
Sales Conversion
Sales Cycle Length
LTV - Lifetime Value
Admin / G&A
Corporate Automation
Headcount Management
Product Refinement
R&D Costs
Interest Burden
Debt Levels
Credit Rating / Rates
Cash Reserves
Tax Burden
Jurisdictional Strategy
Tax Credits
Legal Entity Structuregraph LR
subgraph OpEx ["Operating Expenses (Investment)"]
RD[Product Refinement / R&D]
MKT[Marketing & Sales]
end
subgraph Revenue ["Top Line"]
P[Price]
V[Volume]
end
subgraph Margins ["The Multiplication String"]
GM[Gross Margin %]
EBITDA[Business Profit / EBITDA]
DA[Depreciation & Amortization]
IB[Interest Burden]
TB[Tax Burden]
end
%% Connections
RD -->|Increases| P
RD -->|Increases| V
MKT -->|Increases| V
P & V -->|Revenue| GM
GM -->|Product Profit| EBITDA
EBITDA -->|Less Non-Cash Costs| DA
DA -->|Operating Income/EBIT| IB
IB -->|Pre-tax Profit| TB
TB -->|Final Net| NP[Net Profit]
%% Feedback Loop
NP -.->|Reinvest| OpExgraph LR
subgraph Input ["Inputs"]
COGS[COGS: Materials/Labor]
OPEX[OpEx: Marketing/Sales/Admin]
CAPEX[CapEx: New Factory/Tech]
end
subgraph Revenue ["Top Line"]
P[Price]
V[Volume]
end
subgraph Profitability ["Income Statement Funnel"]
REV[Total Revenue]
GP[Gross Profit]
EBITDA[EBITDA]
EBIT[EBIT / Operating Income]
end
%% Flow of Costs
REV -->|Minus COGS| GP
GP -->|Minus OpEx| EBITDA
EBITDA -->|Minus D&A| EBIT
CAPEX -.->|Creates| DA[Depreciation]
DA -.->|Is| EBITDA
%% The "Growth" Arrows you requested
OPEX --> Mkt[Marketing]
OPEX --> Sl[Sales]
OPEX --> Ref[Product Refinement]
Mkt -->|Drives| V
Sl -->|Drives| V
Ref -->|Drives| P
Ref -->|Drives| VCOGS Split: Includes everything “touching” the product before it is finished (Steel, factory electricity, assembly line wages).
OpEx Split: Includes everything "selling or managing" the product (Google Ads, Sales commissions, CEO's salary, office rent).

CapEx Split: This is the "Big Iron." It’s the money spent today to build the factory that will lower your COGS tomorrow through better efficiency.

COGS (Cost of Goods Sold) and OpEx (Operating Expenses) are actually the "killers" of your margins.

COGS is what eats your Revenue to leave you with Gross Margin.

OpEx is what eats your Gross Profit to leave you with Operating Margin (EBITDA).
Where does CapEx sit?
CapEx (Capital Expenditure) is unique because it does not appear on the Income Statement immediately.
When you spend on CapEx (e.g., buying a factory), the cash leaves the company, but it is recorded as an Asset on the Balance Sheet.

It then "leaks" into the Income Statement slowly over years via Depreciation.

Therefore, CapEx is the source of the Depreciation & Amortization (D&A) that sits between EBITDA and EBIT.
mindmap
  root((Net Profit))
    Gross Margin
      ::icon(fa fa-industry)
      Driven by COGS
        Direct Materials
        Direct Labor
        Inbound Logistics
      Affected by
        Price Strategy
        Volume / Absorption
    Operating Margin
      ::icon(fa fa-chart-line)
      Driven by OpEx
        Marketing & Ads --> Drives Volume
        Sales Teams --> Drives Volume
        R&D / Refinement --> Drives Price
        G&A / Admin
      EBITDA
        Operating Cash Flow
    Capital Strategy
      ::icon(fa fa-building)
      CapEx
        New Machinery
        Facility Expansion
        Tech Infrastructure
      Depreciation
        The 'Bridge' from CapEx to OpEx
    Financials
      Interest Burden
      Tax Burden
To add Price and Volume to our multiplication string, we have to move one step “above” the margins and look at how Revenue itself is constructed.
In this expanded view, we start with your “Market Potential” and multiply all the way down to the “Net Profit.”
The “Full Stack” Growth & Profit Formula
Where:
- ** (Volume):** Units sold (The “Scale” lever).
- ** (Price):** Average Selling Price (The “Value” lever).
- GM (Gross Margin): Survival rate after Factory/Production.
- OE (Operating Efficiency): Survival rate after Marketing/Admin.
- IB (Interest Burden): Survival rate after Debt payments.
- TB (Tax Burden): Survival rate after Taxes.
How Price and Volume “Interact” with the Margins
This is the most nuanced part: Price and Volume are not independent variables. They have a “tug-of-war” effect on your margins.
1. The Price () Lever
If you increase by 10%:
- Revenue: Increases 10%.
- Gross Margin (): Increases more than 10% (because your COGS per unit stayed the same while the top line grew).
- Operating Efficiency (): Improves (your marketing spend now looks smaller relative to the higher revenue).
2. The Volume () Lever
If you increase by 10%:
- Revenue: Increases 10%.
- Gross Margin (): Improves slightly (due to Fixed Cost Absorption in the factory).
- Operating Efficiency (): Might Decrease (because you might have had to spend significantly more on marketing or sales commissions to get that extra volume).
Detailed Granularity: The “Unit” Perspective
If you want to see exactly how one single unit contributes to the final net profit, the formula looks like this:
| Step | Component | Formula | Impact of Price/Volume |
|---|---|---|---|
| 1 | Unit Revenue | Higher = higher starting point. | |
| 2 | Unit Gross Profit | Higher “shrinks” the Fixed COGS per unit. | |
| 3 | Unit Operating Profit | Higher “shrinks” the HQ/Rent cost per unit. | |
| 4 | Unit Net Profit | Final amount that goes into the bank. |
Real-World Example: The “P&G vs. Hermès” Strategy
- P&G Strategy (Volume Focus): They accept a lower to maximize . They rely on the fact that selling 1 billion units will make their Fixed COGS and OpEx per unit almost zero through massive scale.
- Hermès Strategy (Price Focus): They intentionally limit (scarcity) to maximize . They don’t care about “Fixed Cost Absorption” because their is so high it covers all costs 10 times over.
Summary: The COO’s “Golden Ratio”
A COO’s ultimate goal is to find the Price/Volume Sweet Spot where:
- Price is high enough to protect the Gross Margin.
- Volume is high enough to “dilute” the Fixed Operating Costs.
Would you like to see a “Unit Economics” breakdown for a specific product—for example, how many bars of soap P&G has to sell to pay for one $30 million Super Bowl ad?
Exactly. You have just described the Growth Engine of the company.
When a COO and CEO decide to spend money on Operating Expenses (OpEx), they aren’t just “paying bills”—they are making an investment to shift the demand curve. Here is the specific logic for how those two expenses (Marketing and Product Refinement) affect (Price) and (Volume):
1. Product Refinement (The “Quality” Lever)
This usually lives in R&D or Product Development costs.
- Impact on (Pricing Power): By making the product better, more durable, or more unique, you make it “inelastic.” This means customers are willing to pay a premium, allowing you to **raise ** without losing people.
- Impact on (Retention/Expansion): A better product reduces “churn” (customers leaving) and increases word-of-mouth. This naturally **increases ** because your “leaky bucket” is fixed.
- The Goal: To create Differentiation. If your product is “best in class,” you don’t have to compete on price.
2. Marketing & Sales (The “Awareness” Lever)
This lives in Selling & Marketing costs.
- Impact on (Market Share): This is the primary goal of marketing. By spending on ads and sales teams, you are “buying” more customers, which drives up.
- Impact on (Brand Equity): High-end marketing (like Apple or Hermès) creates a “brand halo.” This allows the company to **maintain a high ** even when competitors are cheaper.
- The Goal: To create Customer Acquisition.
The COO’s “ROI” Calculation
The COO looks at these expenses and asks: “If I spend $1 million extra in OpEx, do I get more than $1 million back in Gross Profit from the new Price and Volume?”
Scenario A: Successful Investment
- Action: You spend $1M on a new feature (Product Refinement).
- Result: You can now charge $10 more per unit ().
- Math: You sell 200,000 units. That’s $2M in extra Gross Profit.
- Outcome: Your Operating Margin increases because the $2M gain outpaced the $1M cost.
Scenario B: The “Commodity Trap” (Unsuccessful)
- Action: You spend $1M on generic ads.
- Result: You get more customers (), but you had to discount the price () to get them.
- Outcome: Your Operating Margin stays flat or drops because the cost of the marketing “ate” all the new profit.
The Full Integrated Formula (The “CEO’s Dashboard”)
Summary Table: OpEx as a Strategic Tool
| Expense Type | Primary Target | Final Goal |
|---|---|---|
| Product R&D | Price () | Higher “Unit Value” (Quality) |
| Marketing | Volume () | Higher “Market Reach” (Awareness) |
| COO Ops | Margin () | Higher “Process Efficiency” (Cost) |
Would you like to see how this looks for a “SaaS” company (like Microsoft/Adobe) vs. a “Physical” company? They use these levers very differently.
To add Price and Volume to our multiplication string, we have to move one step “above” the margins and look at how Revenue itself is constructed.
In this expanded view, we start with your “Market Potential” and multiply all the way down to the “Net Profit.”
The “Full Stack” Growth & Profit Formula
Where:
- ** (Volume):** Units sold (The “Scale” lever).
- ** (Price):** Average Selling Price (The “Value” lever).
- GM (Gross Margin): Survival rate after Factory/Production.
- OE (Operating Efficiency): Survival rate after Marketing/Admin.
- IB (Interest Burden): Survival rate after Debt payments.
- TB (Tax Burden): Survival rate after Taxes.
How Price and Volume “Interact” with the Margins
This is the most nuanced part: Price and Volume are not independent variables. They have a “tug-of-war” effect on your margins.
1. The Price () Lever
If you increase by 10%:
- Revenue: Increases 10%.
- Gross Margin (): Increases more than 10% (because your COGS per unit stayed the same while the top line grew).
- Operating Efficiency (): Improves (your marketing spend now looks smaller relative to the higher revenue).
2. The Volume () Lever
If you increase by 10%:
- Revenue: Increases 10%.
- Gross Margin (): Improves slightly (due to Fixed Cost Absorption in the factory).
- Operating Efficiency (): Might Decrease (because you might have had to spend significantly more on marketing or sales commissions to get that extra volume).
Detailed Granularity: The “Unit” Perspective
If you want to see exactly how one single unit contributes to the final net profit, the formula looks like this:
| Step | Component | Formula | Impact of Price/Volume |
|---|---|---|---|
| 1 | Unit Revenue | Higher = higher starting point. | |
| 2 | Unit Gross Profit | Higher “shrinks” the Fixed COGS per unit. | |
| 3 | Unit Operating Profit | Higher “shrinks” the HQ/Rent cost per unit. | |
| 4 | Unit Net Profit | Final amount that goes into the bank. |
Real-World Example: The “P&G vs. Hermès” Strategy
- P&G Strategy (Volume Focus): They accept a lower to maximize . They rely on the fact that selling 1 billion units will make their Fixed COGS and OpEx per unit almost zero through massive scale.
- Hermès Strategy (Price Focus): They intentionally limit (scarcity) to maximize . They don’t care about “Fixed Cost Absorption” because their is so high it covers all costs 10 times over.
Summary: The COO’s “Golden Ratio”
A COO’s ultimate goal is to find the Price/Volume Sweet Spot where:
- Price is high enough to protect the Gross Margin.
- Volume is high enough to “dilute” the Fixed Operating Costs.
Would you like to see a “Unit Economics” breakdown for a specific product—for example, how many bars of soap P&G has to sell to pay for one $30 million Super Bowl ad?
Yes, you have hit the most critical lever in business strategy. Gross Margin is the only margin that is directly “attacked” or “boosted” by your pricing decisions and your sales volume.
In finance, we call this the PVM Analysis (Price, Volume, and Mix). Here is exactly how those two forces change your Gross Margin:
1. The Price Effect (The “Pure” Margin Mover)
Price is the most powerful variable in the entire multiplication string because it has a 1:1 impact on profit.
- If you raise prices: Every extra dollar goes straight to Gross Profit without adding any cost. Your Gross Margin % increases instantly.
- If you discount: Your Revenue drops, but your Costs (COGS) stay the same. This “squeezes” the margin from the top.
- The Hermes Example: Because Hermes has “pricing power,” they can raise the price of a Birkin bag by 10% without their leather or labor costs changing much. Their Gross Margin expands purely through price.
2. The Volume Effect (The “Scale” Mover)
This is where the COO’s factory efficiency meets the Sales team’s performance. Volume affects Gross Margin through something called Fixed Cost Absorption.
Inside your factory (COGS), you have two types of costs:
- Variable Costs: (Leather, wood, hourly wages). These stay the same per unit regardless of volume.
- Fixed Costs: (Factory rent, machinery depreciation, supervisor salaries). These stay the same in total regardless of volume.
The Logic: If your factory rent is a month:
- If you sell 1,000 units, each unit “carries” **** of rent.
- If you sell 10,000 units, each unit “carries” only **** of rent.
Result: By increasing Volume, you “dilute” your fixed costs, which lowers your cost per unit and increases your Gross Margin %.
3. The “Mix” Effect (The Silent Killer)
Since you asked about companies like P&G, “Mix” is vital. P&G sells hundreds of products.
- High Margin: Face creams (SK-II).
- Low Margin: Dish soap (Dawn).
- The Impact: Even if your total Sales Volume stays the same, if you sell more soap and less face cream this month, your overall Gross Margin % will drop.
Summary: Price vs. Volume in the Formula
| Change | Impact on Gross Margin % | Why? |
|---|---|---|
| Price Increase | High Increase | Pure profit; no extra cost attached. |
| Price Discount | High Decrease | Revenue falls; factory costs remain. |
| Volume Increase | Moderate Increase | Spreads fixed factory costs over more units. |
| Volume Decrease | Moderate Decrease | Each unit becomes more expensive to make. |
The “COO’s Dilemma”
A COO often has to choose:
- Lower the Price to drive Volume (hoping the “Fixed Cost Absorption” makes up for the lower price).
- Hold the Price and accept Lower Volume (relying on “Brand Prestige” to keep margins high).
Would you like to see a quick calculation of how many more units a company like P&G has to sell to break even if they offer a 10% discount?
This is where the theory gets exciting. By looking at these four companies, you can see how different “business models” prioritize different parts of the multiplication string.
I’ve used estimated data for 2024/2025 to show you the “Survival Rates” for each company.
The Grand Multiplication Table (Est. 2024/2025)
| Company | Gross Margin (Factory/Product) | Op. Efficiency (Mktg/Sales/Admin) | Interest Burden (Financial) | Tax Burden (Legal) | Final Net Margin |
|---|---|---|---|---|---|
| Hermès | 70% | 58% | 1.04* | 71% | ~30% |
| P&G | 51% | 45% | 96% | 75% | ~17% |
| Hess Midstream | 78% | 85% | 73% | 77% | ~37% |
| Realty Income | 90% | 20% | 45% | 98% | ~8% |
*Note: Hermès has so much cash that their “Interest Burden” is over 1.0 because they earn more interest on their cash than they pay on debt.
Granular Breakdown by Company Strategy
1. Hermès: The “Pricing Power” King
- Gross Margin (70%): This is incredibly high. It means it only costs them about 30 cents (materials and “petits mains” labor) to make a dollar of product.
- Op. Efficiency (58%): They don’t spend much on traditional marketing. Most of this goes to their beautiful stores and elite staff.
- The Result: Because they start so high at the “Factory” level, they can afford a luxurious HQ and still keep 30 cents of every dollar.
2. P&G: The “Marketing Machine”
- Gross Margin (51%): It costs a lot to make soap and diapers. This is where the COO focuses on factory automation.
- Op. Efficiency (45%): Notice this is lower than Hermès. P&G spends billions on ads. Only 45% of their Gross Profit “survives” the marketing and sales departments.
- The Result: They are a volume business. They accept a lower net margin (~17%) because they sell to billions of people.
3. Hess Midstream (HESM): The “Infrastructure” Model
- Gross Margin (78%): Once the pipes are in the ground, they are very cheap to run.
- Op. Efficiency (85%): Very high! They don’t need a huge marketing team to “convince” oil to flow through a pipe.
- Interest Burden (73%): Here is the “leak.” Infrastructure is built with debt. The bank takes 27% of their profit before it gets to the shareholders.
4. Realty Income (O): The “Real Estate” Model
- Gross Margin (90%): They just collect rent. There is almost no “production cost.”
- Op. Efficiency (20%): Wait, what? In Real Estate, “Depreciation” is a massive non-cash expense that lives in the operating line. It looks like a “leak,” but it’s actually a tax shield.
- Interest Burden (45%): They use massive debt to buy buildings. The bank is their biggest partner, taking 55% of the operating profit.
Summary: What to watch for
- If Hermès has a “Gross Margin Drop,” it means they lost their Brand Prestige (they can’t charge enough).
- If P&G has an “Op. Efficiency Drop,” it means their Marketing isn’t working anymore.
- If Hess Midstream has an “Interest Burden Drop,” it means Interest Rates are rising and hurting their debt-heavy model.
Would you like me to create a “What-If” scenario for one of these? For example, seeing how much P&G’s net profit would jump if they cut marketing by just 5%?
This comparison is fascinating because it shows three completely different “engines” of profitability. By looking at Walmart (High Volume), Microsoft (High Scalability), and a Solopreneur SaaS (High Efficiency), we see how the multiplication string shifts.
The Grand Multiplication Table (Est. 2024/2025)
| Company | Gross Margin (Product/COGS) | Op. Efficiency (OpEx/EBITDA) | Interest Burden (Financial) | Tax Burden (Legal) | Final Net Margin |
|---|---|---|---|---|---|
| Walmart | 24% | 18% | 85% | 75% | ~3% |
| Microsoft | 70% | 65% | 100%* | 81% | ~35% |
| SaaS (1 Person) | 90% | 70% | 100% | 85% | ~50% |
*Note: Microsoft has massive cash reserves, so interest expenses are often offset by interest income.
1. Walmart: The “Pennies” Strategy
Walmart is the ultimate Volume player. Their strategy is to keep (Price) as low as possible to drive (Volume) to the moon.
- Gross Margin (24%): This is very low. After paying for the milk, toys, and electronics (COGS), they only have 24 cents left.
- Op. Efficiency (18%): Their OpEx (Store staff, electricity, logistics) eats almost everything else. Only about 4% of total revenue survives as Operating Profit.
- The Logic: Walmart doesn’t care about a high % margin; they care about Inventory Turnover. If they make 3% on a dollar, but they “turn” that dollar 10 times a year, they are incredibly wealthy.
2. Microsoft: The “Scalability” Strategy
Microsoft is a “Software” engine. Once the code is written (CapEx/R&D), it costs almost nothing to sell it to the next billion people.
- Gross Margin (70%): Their COGS is mostly server costs (Azure) and some hardware. 70 cents of every dollar is “free” profit.
- Op. Efficiency (65%): Even with thousands of developers and massive marketing, their Volume is so high that they “dilute” their fixed OpEx. They keep a massive 65% of their Gross Profit as EBITDA.
- The Logic: High + Extreme = Massive Net Margin.
3. SaaS Agency (1 Person): The “Efficiency” Strategy
Think of a single developer running a small tool (like a PDF converter or a niche AI bot).
- Gross Margin (90%): The only COGS is the hosting bill (AWS/Vercel) and maybe an API fee (OpenAI). 90% of the money is theirs.
- Op. Efficiency (70%): This is where it gets interesting. They have no “Staff” (Admin), but they must spend on Marketing (OpEx) to get customers (). If they stop spending on ads, their drops.
- The Logic: This model has the highest Net Margin (~50%), but it lacks Scale. Microsoft can make 35% on $250 Billion; the 1-person SaaS makes 50% on $200,000.
Comparison of the “Levers”
| Component | Walmart | Microsoft | SaaS (1 Person) |
|---|---|---|---|
| Main Lever | Volume () | Price () & Scale | Efficiency (Low OpEx) |
| Biggest Cost | Inventory (COGS) | R&D & Salaries (OpEx) | Marketing / Ads (OpEx) |
| CapEx Role | Massive (Warehouses) | High (Data Centers) | Low (A Laptop) |
Why the 1-Person SaaS is “Fragile”
Notice that the Solopreneur has a huge Net Margin, but if their “Marketing Efficiency” (CAC) doubles, their profit can vanish instantly.
Walmart, however, is protected by its sheer size; even if their costs go up, their “Supply Chain” (Gross Margin) is so optimized that they can survive on “thinner air” than anyone else.
About Business Efficiency
This relates closely with a business unit economics.
Sample Indie Hacker Flow
To visualize a Solopreneur SaaS, think of it as a “High-Pressure Funnel.”
Because there is only one person, the costs are extremely low, but the reliance on Marketing (OpEx) to drive Volume () is absolute.
Here is a sample flow for a niche AI-SaaS tool that sells a monthly subscription.
- The Numbers: “The $100k Solo-Run”
- Price (): $20/month
- Volume (): 500 active users (Monthly Revenue = $10,000)
- Annual Revenue: $120,000
- The Multiplication String
| Stage | Math Factor | Value | The “Why” |
|---|---|---|---|
| Gross Margin | Survival: 95% | COGS: Hosting ($300) + AI API fees ($200). Very little “factory” cost. | |
| Op. Efficiency | Survival: 60% | OpEx: Google/Meta Ads ($3k) + Software tools ($500). Marketing is the biggest “leak.” | |
| EBITDA | Cash Flow | $5,700/mo | This is what the owner actually sees in the bank before taxes. |
| Interest Burden | Survival: 100% | No bank loans or debt. The solopreneur owns 100%. | |
| Tax Burden | Survival: 80% | Self-employment tax and income tax (Est. 20%). | |
| Final Net | Total Result | $4,560/mo | Net Profit Margin: ~45% |
- The Flow Diagram (Mermaid)
This diagram shows how the owner’s effort in Marketing is the “spark” that starts the entire engine.
graph LR
    subgraph Growth ["Owner's Effort"]
        MKT[Marketing Spend: $3.5k]
        DEV[Product Updates: $0]
    end

    subgraph Unit ["The Sale"]
        V[500 Users]
        P[$20/mo]
    end

    subgraph Funnel ["The Drain"]
        REV[Revenue: $10k]
        GP[Gross Profit: $9.5k]
        EBT[EBITDA: $6k]
        NI[Net Profit: $4.5k]
    end

    %% Connections
    MKT -->|Drives| V
    DEV -->|Protects| P
    V & P --> REV
    REV -- "minus Hosting/API (COGS)" --> GP
    GP -- "minus Marketing (OpEx)" --> EBT
    EBT -- "minus Taxes" --> NI

    %% Feedback Loop
NI -.->|Reinvest in Ads| MKT- Key Takeaways for the Solopreneur
The “Supply Chain” is Digital:
For this agency, the “Supply Chain” isn’t ships and trucks; it is the API connectivity. If the AI provider (like OpenAI) raises their prices, the Gross Margin drops immediately. The COO (the same person!) must then decide to raise the Price () to compensate.
The OpEx is the “Fuel”:
In a 1-person SaaS, the Operating Efficiency is almost entirely dominated by Marketing.
If the “Ad Cost per Click” goes up, the margin shrinks.
This is why solopreneurs focus on “Product Refinement” (R&D)—they want a product so good it sells via word-of-mouth (organic ), which eliminates the need for paid ads and skyrockets the Operating Margin.
The CapEx is Zero:
Unlike Walmart or Microsoft, the solopreneur usually has zero CapEx.
They don’t buy buildings or servers. They “rent” them (OpEx).
This makes the business very “light” but also means they don’t have many assets to sell if they want to exit.
Would you like to see what happens to this flow if the solopreneur decides to scale to 5,000 users and has to hire a Customer Support person?
To get the most granular view, we start with the “Top Line” (Units and Price) and apply each “Survival Rate” (the margins and burdens) until we reach the “Bottom Line.”
The “Full Stack” Multiplicative Formula
If we define:
V=Volume (Units Sold)
P=Price (Average Selling Price)
GM=Gross Margin Ratio(RevenueGross Profit)
OE=Operating Efficiency Ratio(Gross ProfitEBITDA)
IB=Interest Burden(EBITPre-tax Income)
TB=Tax Burden(Pre-tax IncomeNet Income)
The formula for Net Profit (NP) is: NP=(V×P)×GM×OE×IB×TB
Breaking Down the Math (Step-by-Step)
Each multiplication represents a “filter” in your business funnel. Using the 1-person SaaS example (, ):
- Revenue Generation: (This is your starting total.)
- Product Production (Gross Margin): (You lost 5% to the “Factory/API/Servers”.)
- Business Operation (Operating Efficiency): (You lost 40% of the remainder to “Marketing/Sales/Admin”.)
- Financial Structure (Interest Burden): (You lost 0% because you have no debt.)
- Legal/State (Tax Burden): (The government took 20%, leaving you with the final Net Profit.)
The Final “Unit Economics” Formula
If you want to know how much Net Profit you make per unit sold, you simply remove the Volume () from the start:
For the SaaS agency, every new user signed up at $20 results in $9.12 () in the owner’s pocket after everyone else has been paid.
Why this formula is powerful
It allows you to perform Sensitivity Analysis. You can ask:
- “What happens to Net Profit if I double my Volume () but my Operating Efficiency () drops to 0.30 because ads got more expensive?”
- “If I raise my Price () by 10%, how much can my Gross Margin () drop before I start losing money?”
Would you like me to calculate a “Break-Even” scenario for this formula to see at what Volume () the profit becomes zero?