Monitoring for HomeLab
If you are just looking from the devops tools angle or just need to see how your ebook service uptime is behaving - you will need some Monitoring.
If you are building, dont be scare of the http status codes: https://it-tools.tech/http-status-codes
And see these tools for internet monitoring
You can also make a avg internet speed test when downloading OSS OS via P2P or when uploading your videos to youtube.
You might see these kind of status pages around: https://status.perplexity.com/, see https://instatus.com/pricing
Or even advanced ones like:
Not only AWS will have outages.
But also cloudflare…and Github
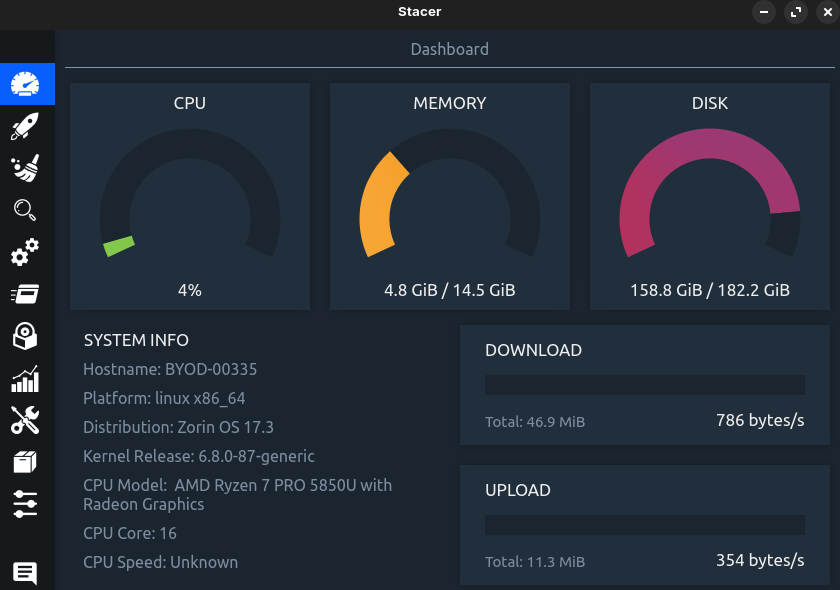
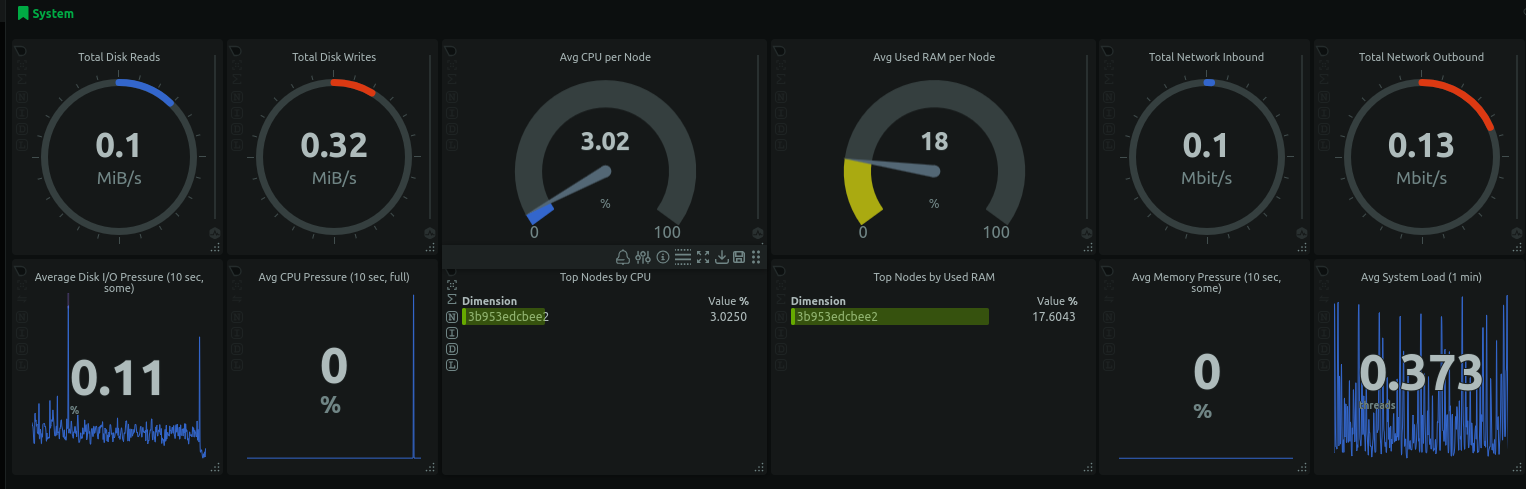
You can try with a NetData or a custom Grafana dashboard for monitoring:
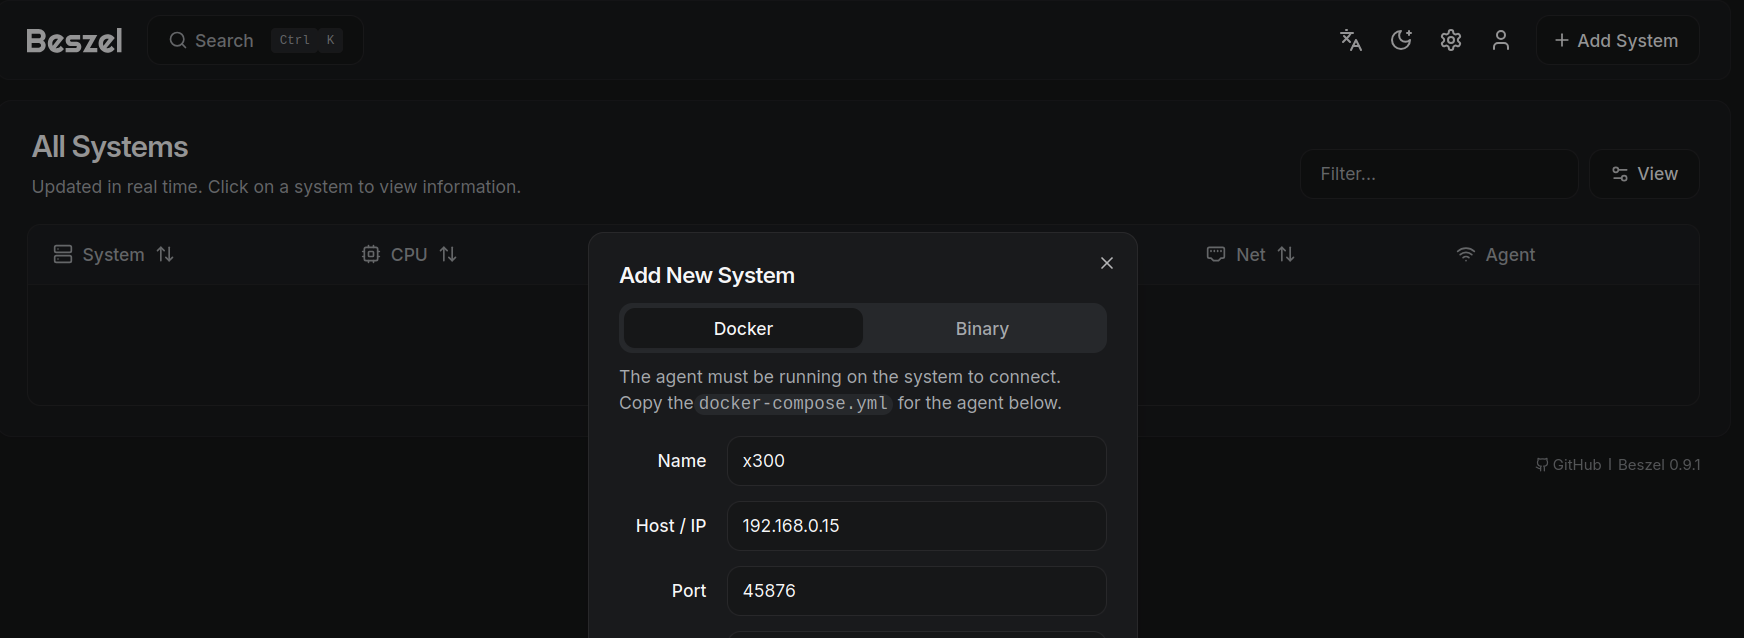
Or just with Beszel:
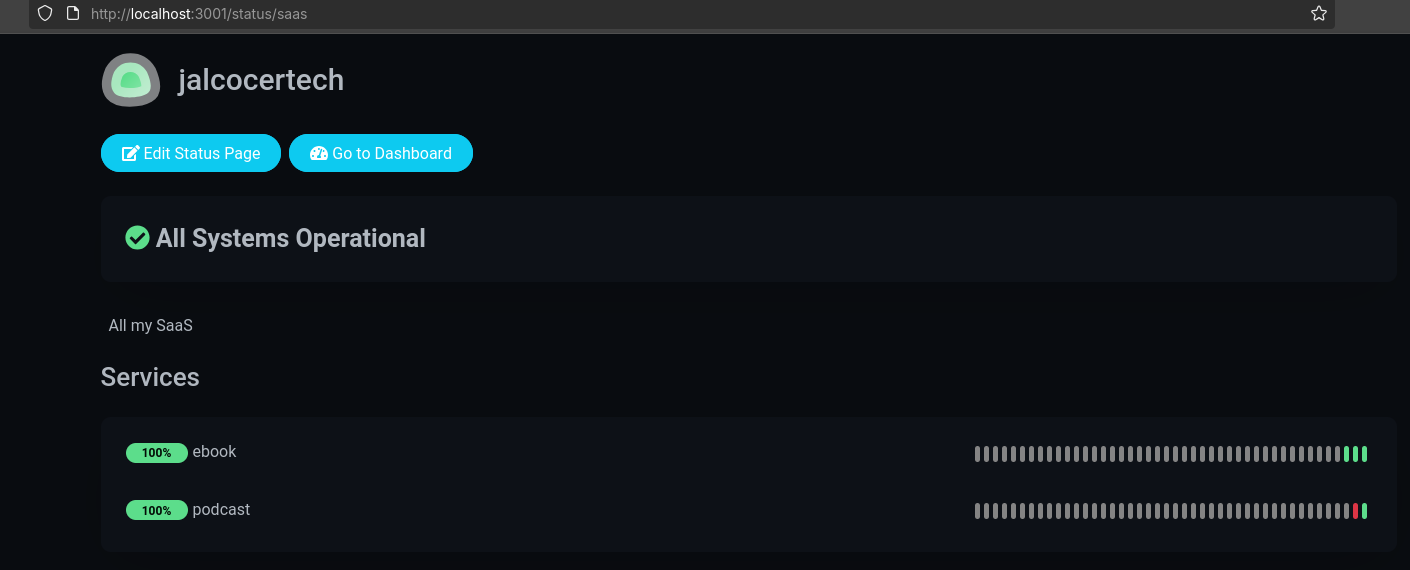
Also, with Uptime Kuma, you can get quickly an uptime pages for your services:
git clone https://github.com/JAlcocerT/Home-Lab
#git pull
cd Home-Lab/uptime-kuma
#sudo docker compose up -d
#docker ps -a --filter "name=uptimekuma"
uv run scripts/bulk_add_monitors.py #tweak the json and the .env to add your monitors
See details for the script here
Uptime Kuma status pages example: https://status.tromsite.com/status
See also how Peekaping
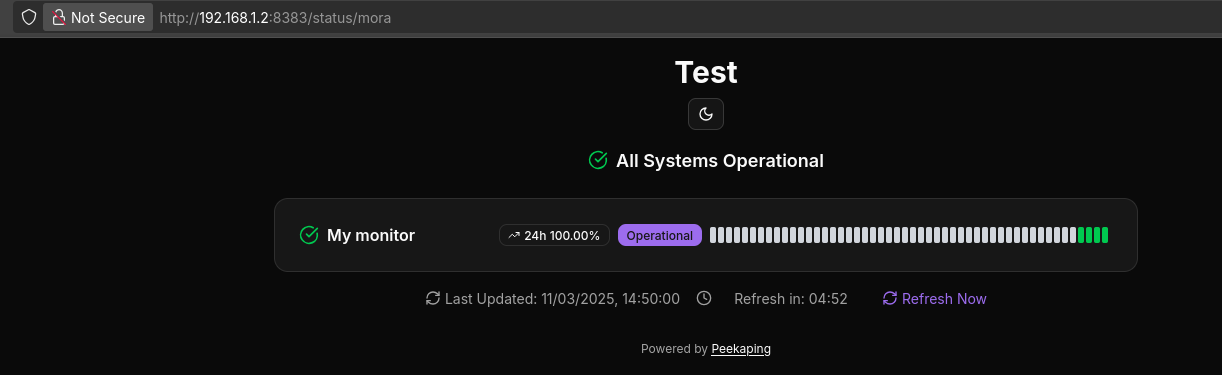
<p>
    <img src="https://your-peekaping-instance.com/api/v1/badge/api-monitor/status" alt="API Status" />
</p>
As I have it running locally: http://192.168.1.2:8383/monitors these are rendered via hugo server
Which can be embeded into your posts and websites via its API, like:
Another option, is Kener
Rather than a way to admire how people have created static status pages: https://open-slum.pages.dev/ nor get…things online.
Uptime monitor / status pages in cloudflare pages
Or Tianji, which does more than just web analytics:
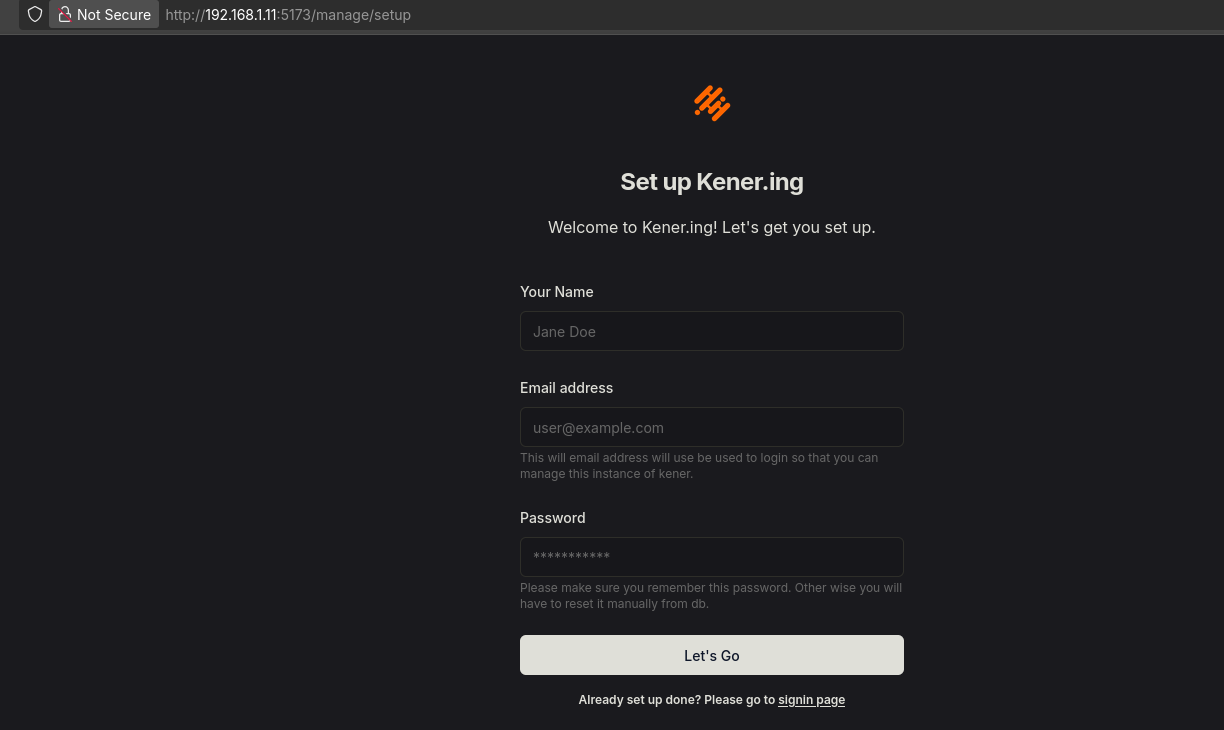 Using Kener Monitoring
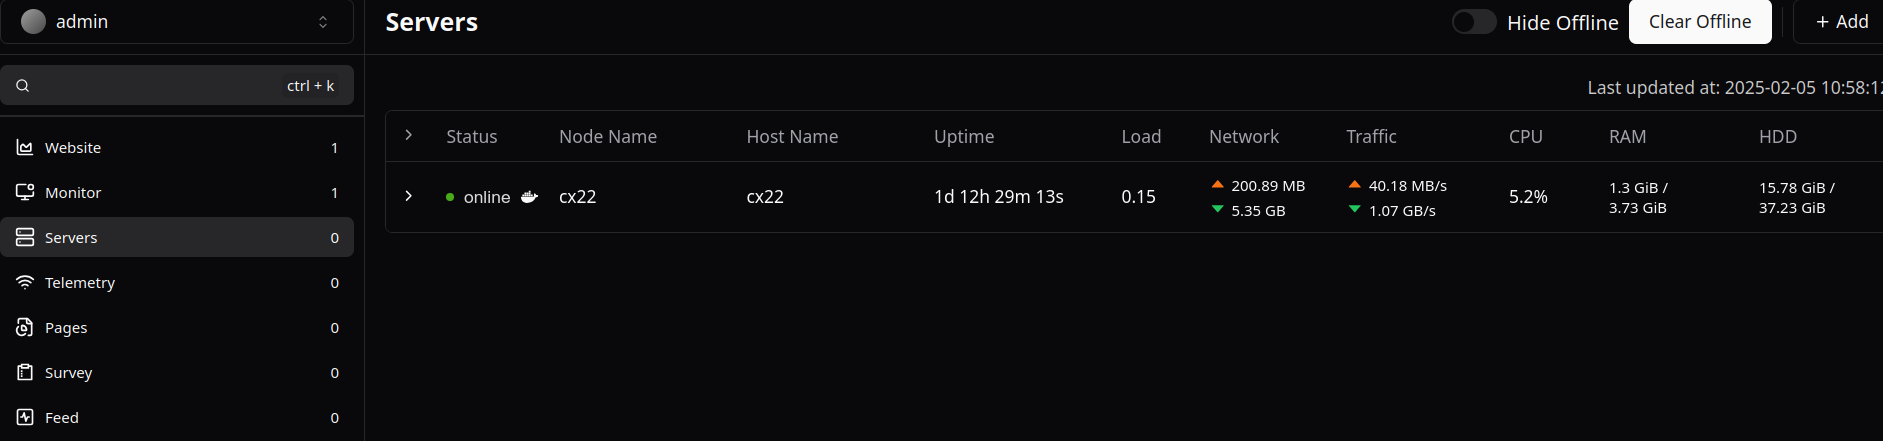 Using Tianji
Internet Monitoring
Whether you have a homelab or you are just tired of you ISP, you might need these.
- https://www.speedtest.pl/
- See also
speed.cloudflare.com
Testing Internet Connectivity
ip addr show
hostname -I

#sudo apt-get install net-tools
#ifconfig

ping -c 4 192.168.3.1 #gateway
ping 9.9.9.9 #quad9
sudo apt-get install dnsutils -y #dns resolution
nslookup github.com
dig google.comcurl -sS https://ipinfo.io/json #the command to use
curl -sS http://ip-api.com/json/ #provides info about country, ISP, ...
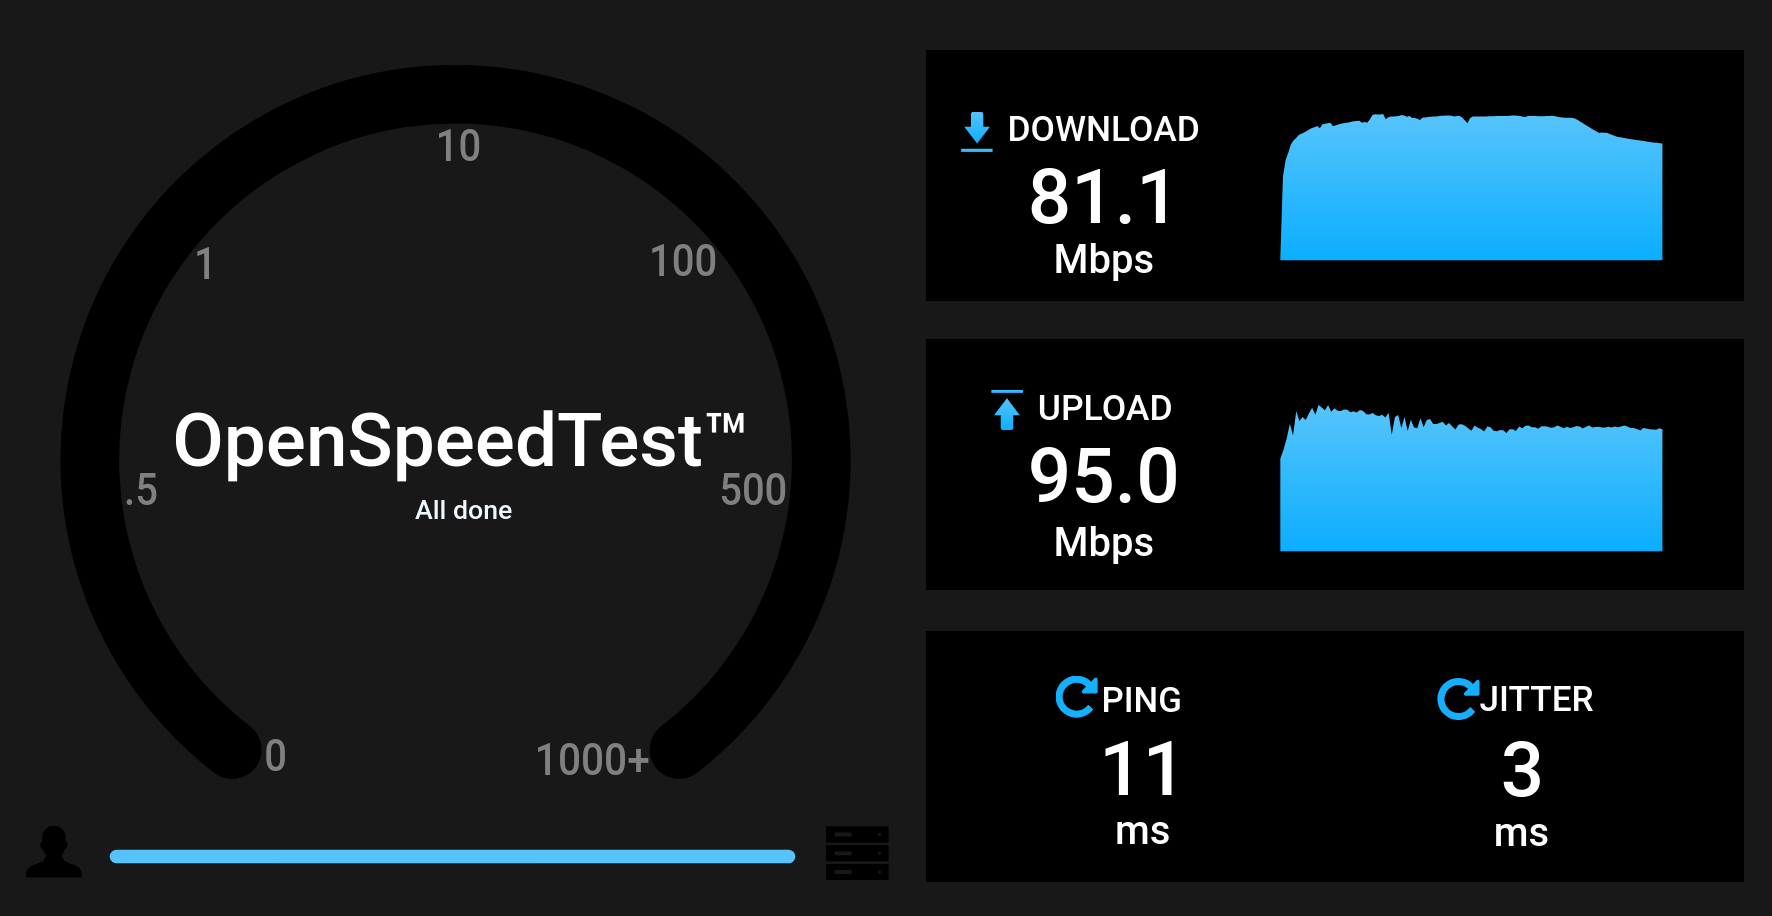
curl -6 ifconfig.me #ipv6 info - Open Speed Test: OST
We can use OpenSpeedTest together with Container and Portainer to deploy the docker compose.
Just go to OST UI dashboard at: localhost:6040
- SpeedTest CLI:
sudo apt-get install speedtest-cli
speedtest-cli #speedtest-cli --simple
#npm install -g fast-cli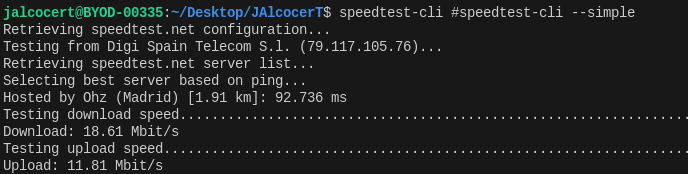
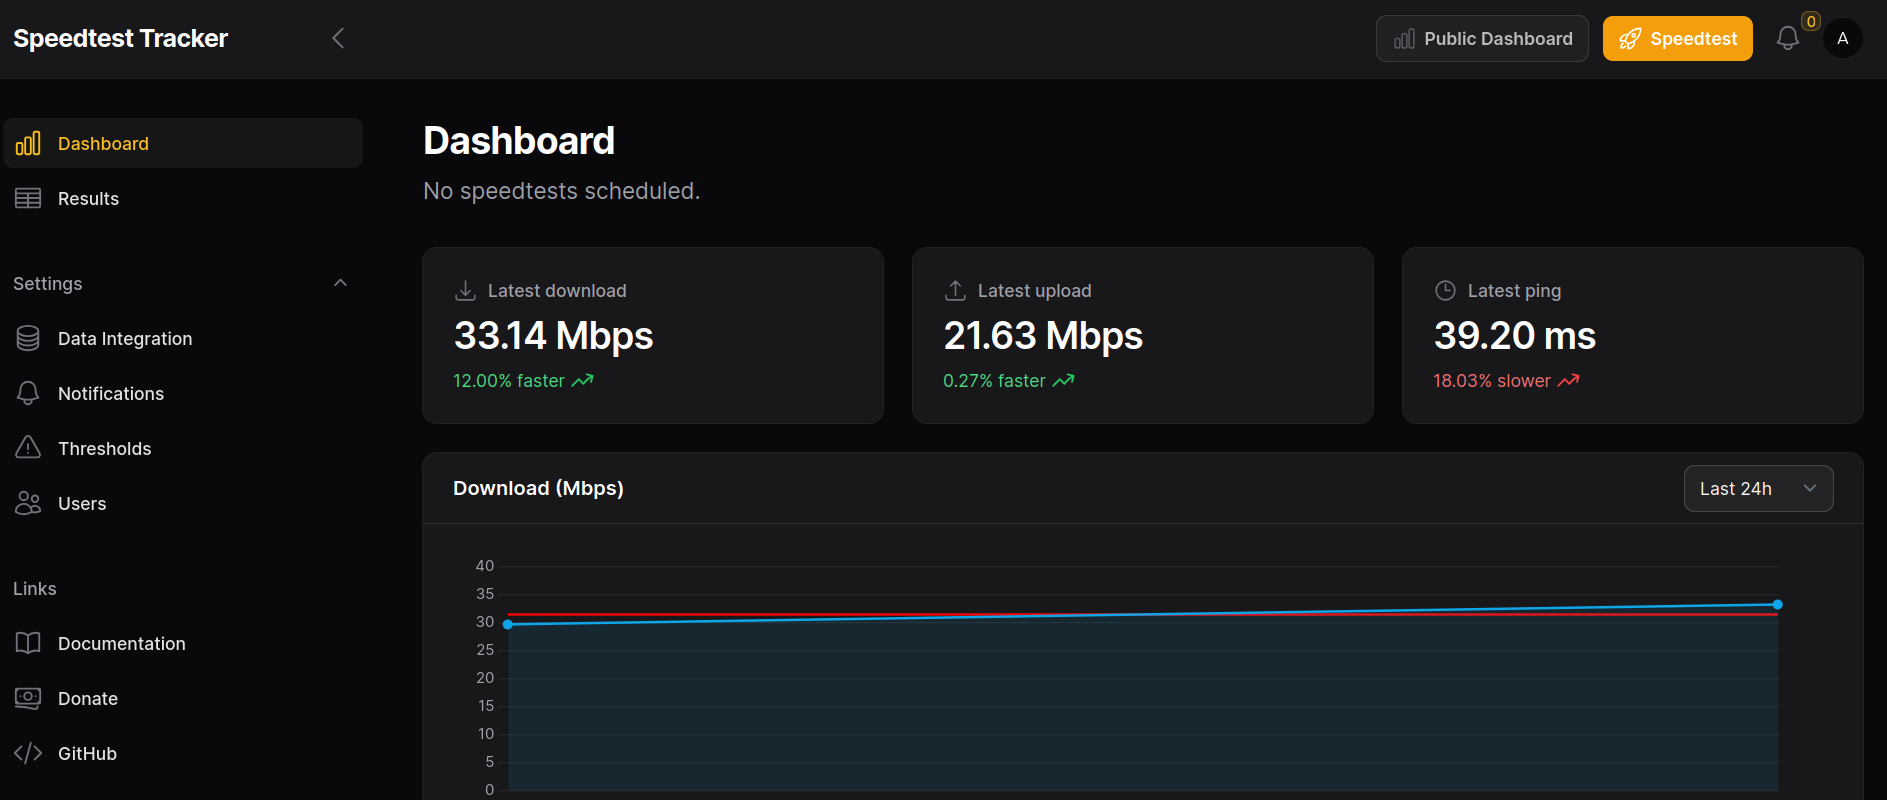
- Speed Test Tracker:
I mentioned about SpeedTest-Tracker, which we can use to test our internet connectivity:
echo -n 'base64:'; openssl rand -base64 32; #generte API keyNow the container image is provided by lscr instead of GHCR:
Go to the UI at:
http://192.168.1.101:8089/with default credsadmin@example.comandpassword