Just maps
TL;DR
Intro
I just got to know these:
- https://mapy.geoportal.gov.pl/imap/Imgp_2.html
- https://deweloperuch.pl/ceny-transakcyjne/warszawa/
- https://www.data.gouv.fr/datasets/demandes-de-valeurs-foncieres
- https://explore.data.gouv.fr/fr/immobilier?onglet=carte&filtre=tous
- https://www.ine.es/buscar/searchResults.do?searchString=Censo+anual+de+poblaci%C3%B3n&Menu_botonBuscador=&searchType=DEF_SEARCH&startat=0&L=0
On top of:
PostGIS: Free Open Source Spatial Database
Openrouteservice: Free Open Source Geo-services API
Which sounds like some how to reitti that we covered here
Geo and R
Some time ago I was impressed but R language and its amazing maps analytics toolset.
When working around consumer intelligence and FMCG, I was mapping population to consumptions patterns.
Quite interesting stuff.
Luckily, the population part is open information for the public.
So here we go again and building around it:
- https://github.com/JAlcocerT/R/tree/main/spain_census_map
- https://github.com/JAlcocerT/R_Dashboard
- https://github.com/JAlcocerT/R_is_Great/tree/main/Maps
#sudo apt install gh
gh auth login
#gh repo create eda-geospatial --private --source=. --remote=origin --push

git init && git add . && git commit -m "Initial commit: simple eda-geospatial" && gh repo create eda-geospatial --private --source=. --remote=origin --push
find . -type f -size +100M -exec ls -lh {} +

head -n 100 ValeursFoncieres-2024.txt > french2024subset.txt
uv run python -c "import pandas as pd;
> df = pd.read_csv('french2024subset.txt', sep='|', low_memory=False);
> res = df[(df['Nature mutation'] == 'Vente') & (df['Type local'].isin(['Maison', 'Appartement']))].copy();
> res['Value'] = res['Valeur fonciere'].astype(str).str.replace(',', '.').astype(float);
> res['Surface'] = res['Surface reelle bati'].astype(str).str.replace(',', '.').astype(float);
> res = res[res['Surface'] > 0];
> res.loc[:, 'price_m2'] = res['Value'] / res['Surface'];
> print(f'Count of Residential Sales: {len(res)}');
> if len(res) > 0:
>     print(f'Average Price per m2: {res[\"price_m2\"].mean():.2f} €/m2');
>     print(f'Average Transaction Price: {res[\"Value\"].mean():.2f} €');
> else:
>     print('No valid residential sales found in this subset.');"
Count of Residential Sales: 9
Average Price per m2: 2551.91 €/m2
Average Transaction Price: 172833.33 €
find . -name "*.shx" -o -name "*.dbf" -o -name "*.prj"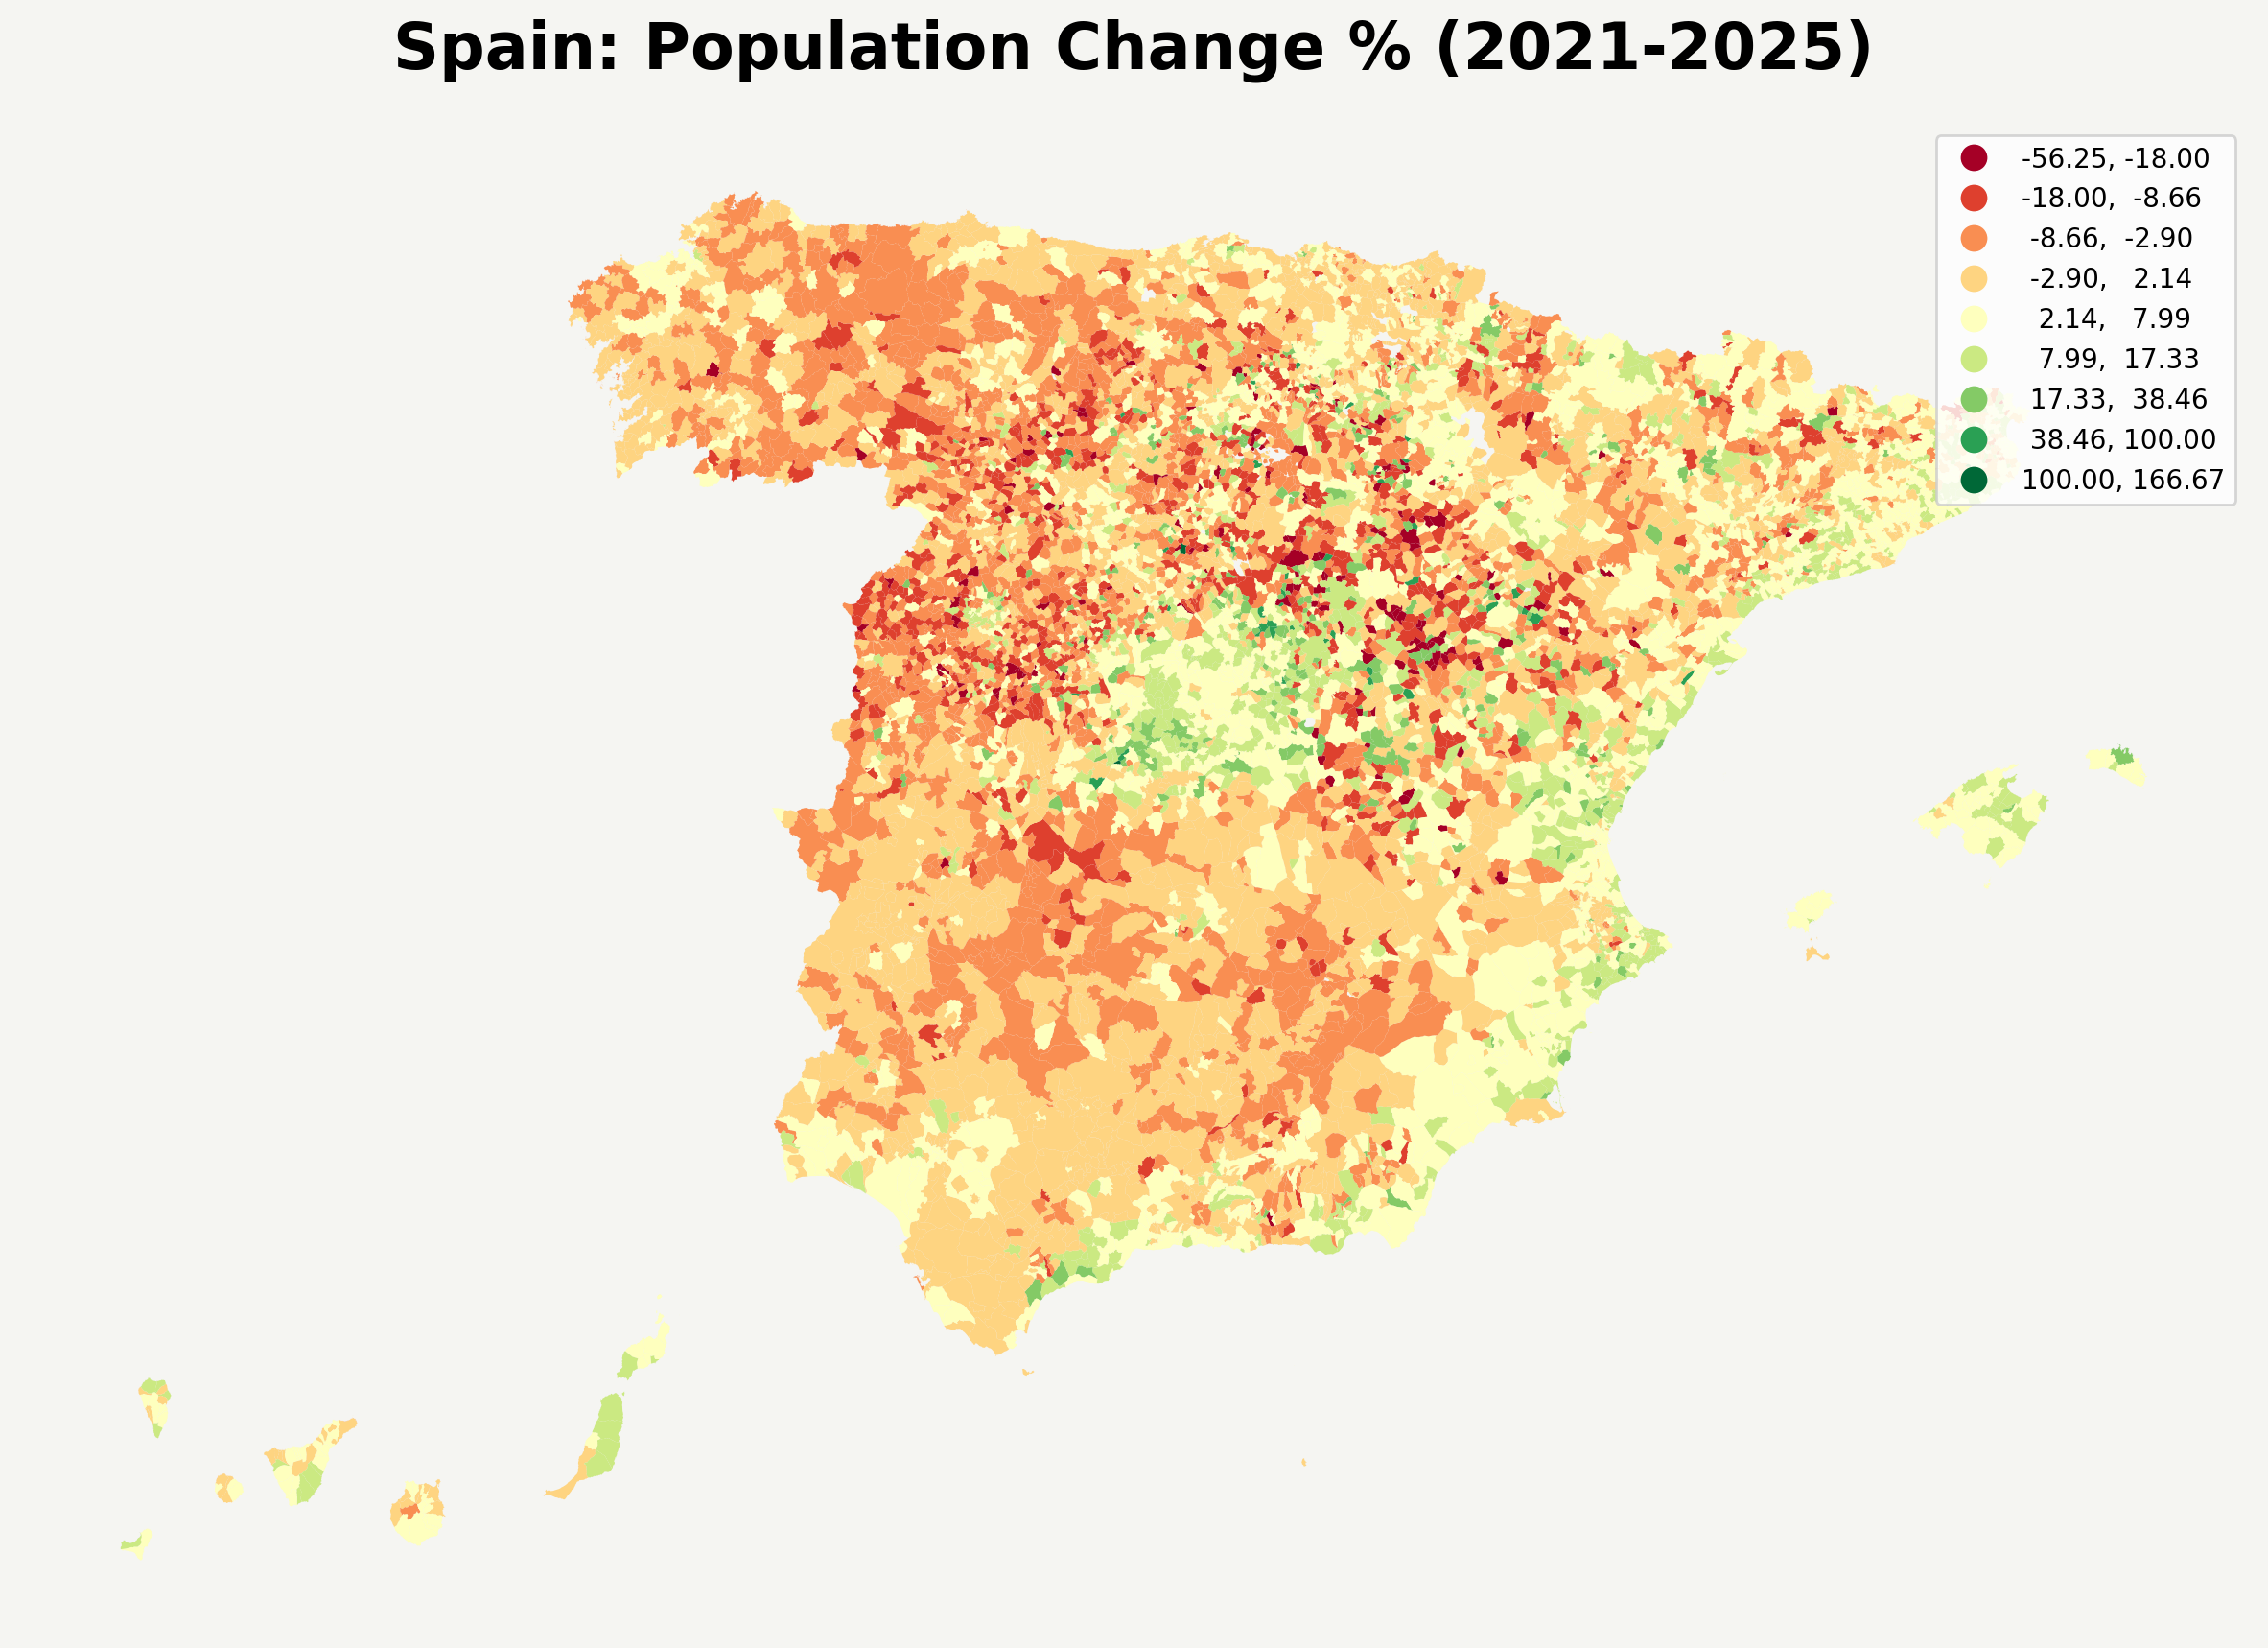
Powered with ine data (derived) which you can get here under CC4.0
wget https://raw.githubusercontent.com/gregoiredavid/france-geojson/master/communes-version-simplifiee.geojson -O france_communes.geojson
uv run calculate_french_averages.py
Calculating national averages and analyzing outliers (2024 DVF)...
Processing in chunks - please wait...

==================================================
FRANCE REAL ESTATE ROBUST STATS (2024 DVF)
==================================================
Total Sales Processed: 986,176

--- Means (Sensitive to Outliers) ---
Avg Price per m²:          16,850.34 €/m²
Avg Transaction Price:     898,225.51 €

--- Medians (Robust) ---
Median Price per m²:       2,664.19 €/m²
Median Transaction Price:  195,600.00 €

--- Percentiles ---
5th Percentile (Price):    47,500.00 €
25th Percentile (Price):    120,000.00 €
75th Percentile (Price):    325,000.00 €
95th Percentile (Price):    1,209,850.00 €
99th Percentile (Price):    15,500,000.00 €
==================================================

Generating outlier scatter plot...
Scatter plot saved as french_price_scatter.png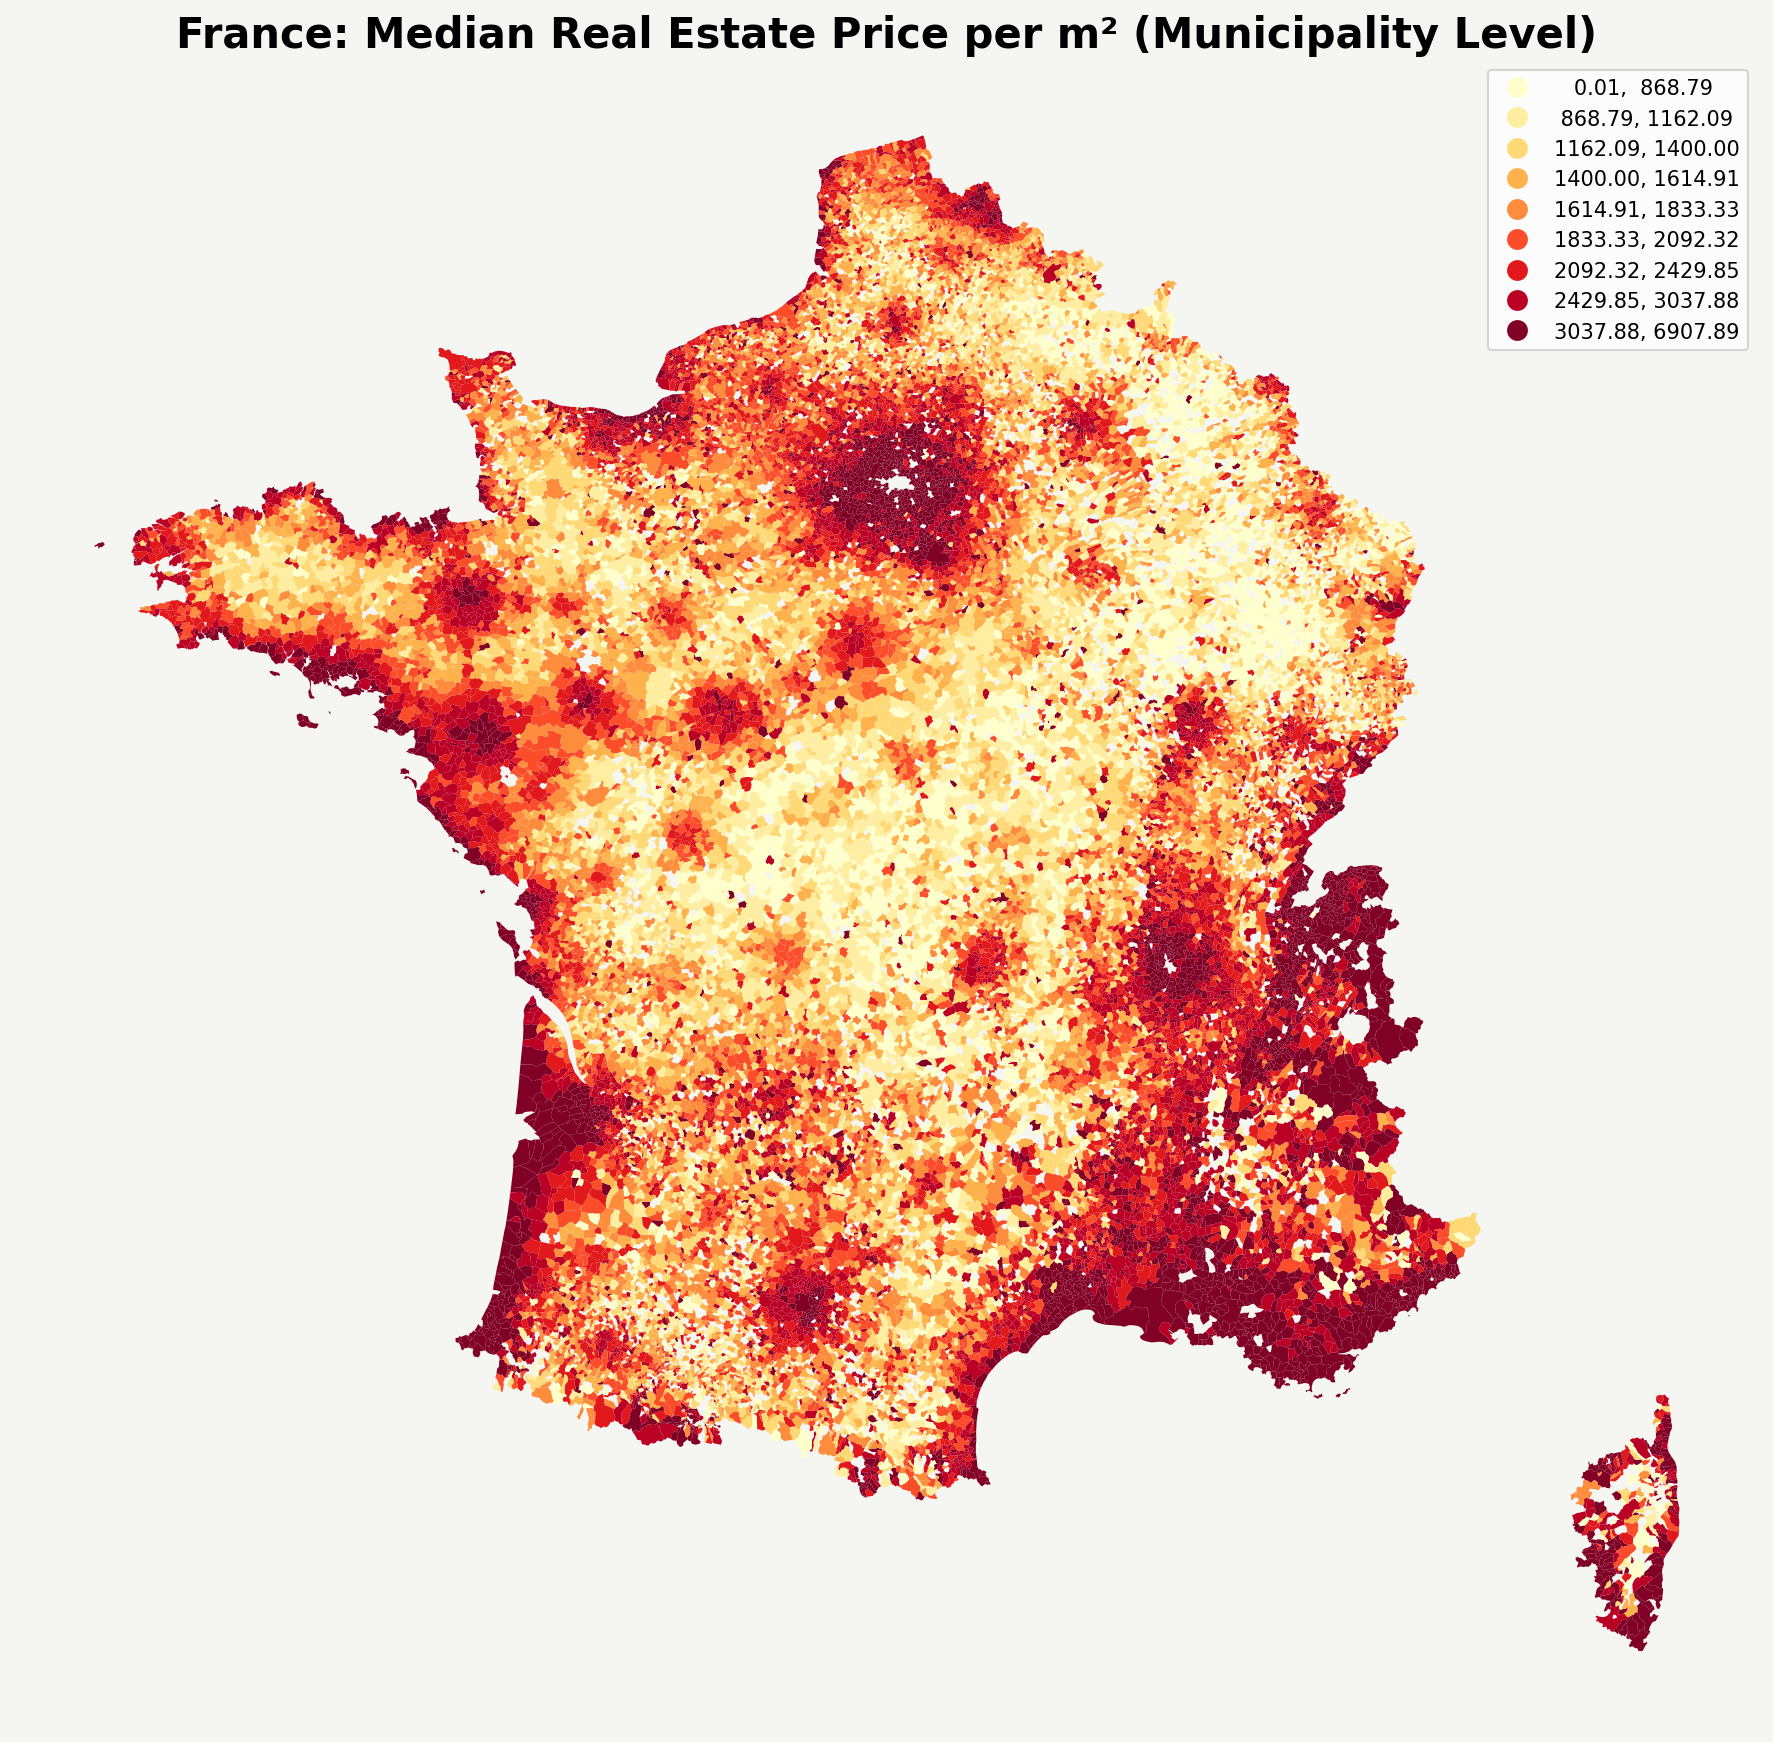
Thanks again to https://www.data.gouv.fr/datasets/demandes-de-valeurs-foncieres where you can take 5 years back of TRANSACTIONS!
Conclusions
Few years ago with R I enjoyed their geo capabilities.
Maps and data are cool, lets agree on that.
And in the upcoming days, I will be sharing few posts about geo + time = motion data :)
If you were expecting a post about the geometric series of improvements of LLMs, this was not your post.