Just maps
TL;DR
Doing analytics on top of maps was not as easy 5y ago…
Intro
Few years ago I was impressed by charts like those from Kartografia ekstremalna on fb.
Not sure how that project goes, but…
I just got to know these:
- https://mapy.geoportal.gov.pl/imap/Imgp_2.html
- https://deweloperuch.pl/ceny-transakcyjne/warszawa/
- https://www.data.gouv.fr/datasets/demandes-de-valeurs-foncieres
- https://explore.data.gouv.fr/fr/immobilier?onglet=carte&filtre=tous
- https://www.ine.es/buscar/searchResults.do?searchString=Censo+anual+de+poblaci%C3%B3n&Menu_botonBuscador=&searchType=DEF_SEARCH&startat=0&L=0
On top of: avg household income in ES
PostGIS: Free Open Source Spatial Database
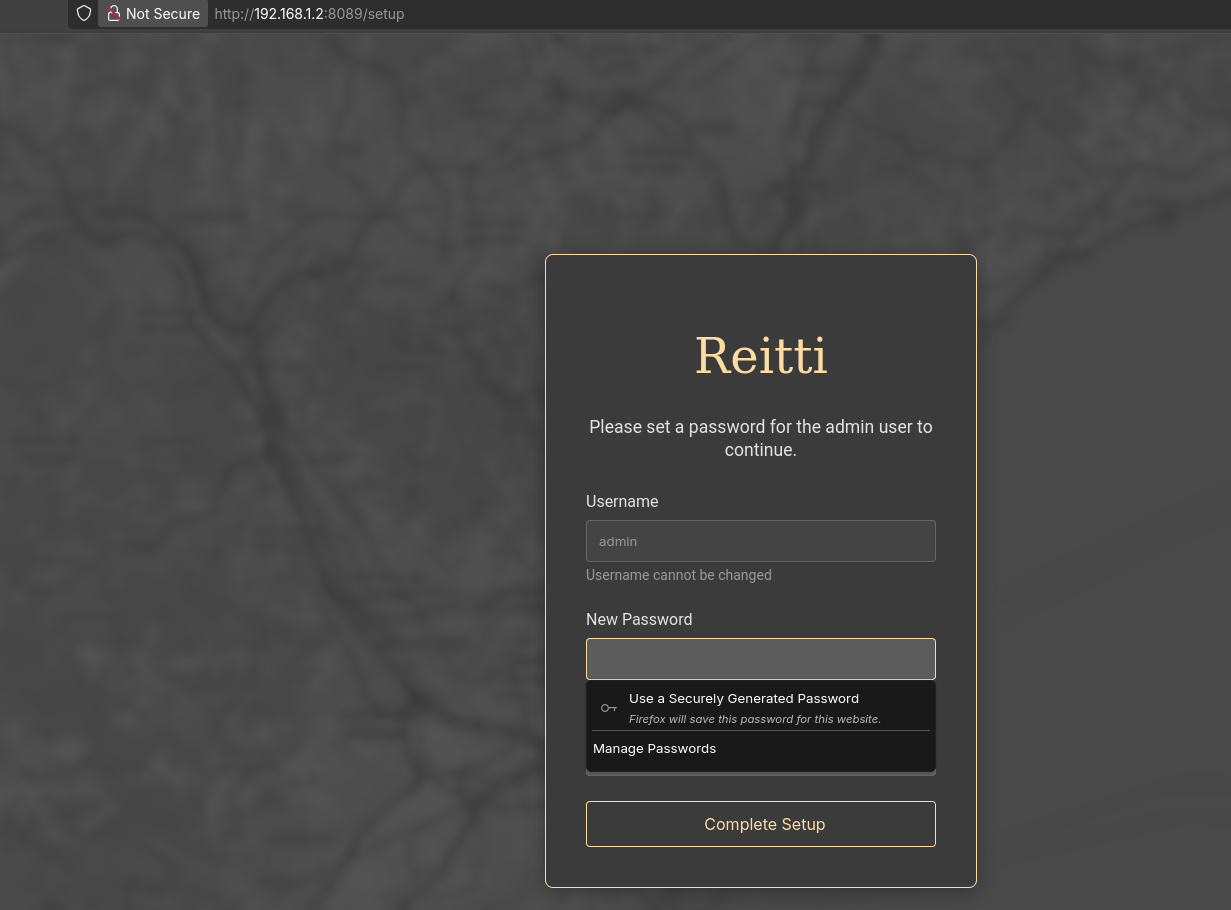
Openrouteservice: Free Open Source Geo-services API
Which sounds like some how to reitti that we covered here
Geo from R to Py
Some time ago I was impressed but R language and its amazing maps analytics toolset.
When working around consumer intelligence and FMCG, I was mapping population to consumptions patterns.
Quite interesting stuff.
Luckily, the population part is open information for the public.
So here we go again and building around it:
- https://github.com/JAlcocerT/R/tree/main/spain_census_map
- https://github.com/JAlcocerT/R_Dashboard
- https://github.com/JAlcocerT/R_is_Great/tree/main/Maps
#sudo apt install gh
gh auth login
#gh repo create eda-geospatial --private --source=. --remote=origin --push

git init && git add . && git commit -m "Initial commit: simple eda-geospatial" && gh repo create eda-geospatial --private --source=. --remote=origin --push
find . -type f -size +100M -exec ls -lh {} +

head -n 100 ValeursFoncieres-2024.txt > french2024subset.txt
uv run python -c "import pandas as pd;
> df = pd.read_csv('french2024subset.txt', sep='|', low_memory=False);
> res = df[(df['Nature mutation'] == 'Vente') & (df['Type local'].isin(['Maison', 'Appartement']))].copy();
> res['Value'] = res['Valeur fonciere'].astype(str).str.replace(',', '.').astype(float);
> res['Surface'] = res['Surface reelle bati'].astype(str).str.replace(',', '.').astype(float);
> res = res[res['Surface'] > 0];
> res.loc[:, 'price_m2'] = res['Value'] / res['Surface'];
> print(f'Count of Residential Sales: {len(res)}');
> if len(res) > 0:
>     print(f'Average Price per m2: {res[\"price_m2\"].mean():.2f} €/m2');
>     print(f'Average Transaction Price: {res[\"Value\"].mean():.2f} €');
> else:
>     print('No valid residential sales found in this subset.');"
Count of Residential Sales: 9
Average Price per m2: 2551.91 €/m2
Average Transaction Price: 172833.33 €
find . -name "*.shx" -o -name "*.dbf" -o -name "*.prj"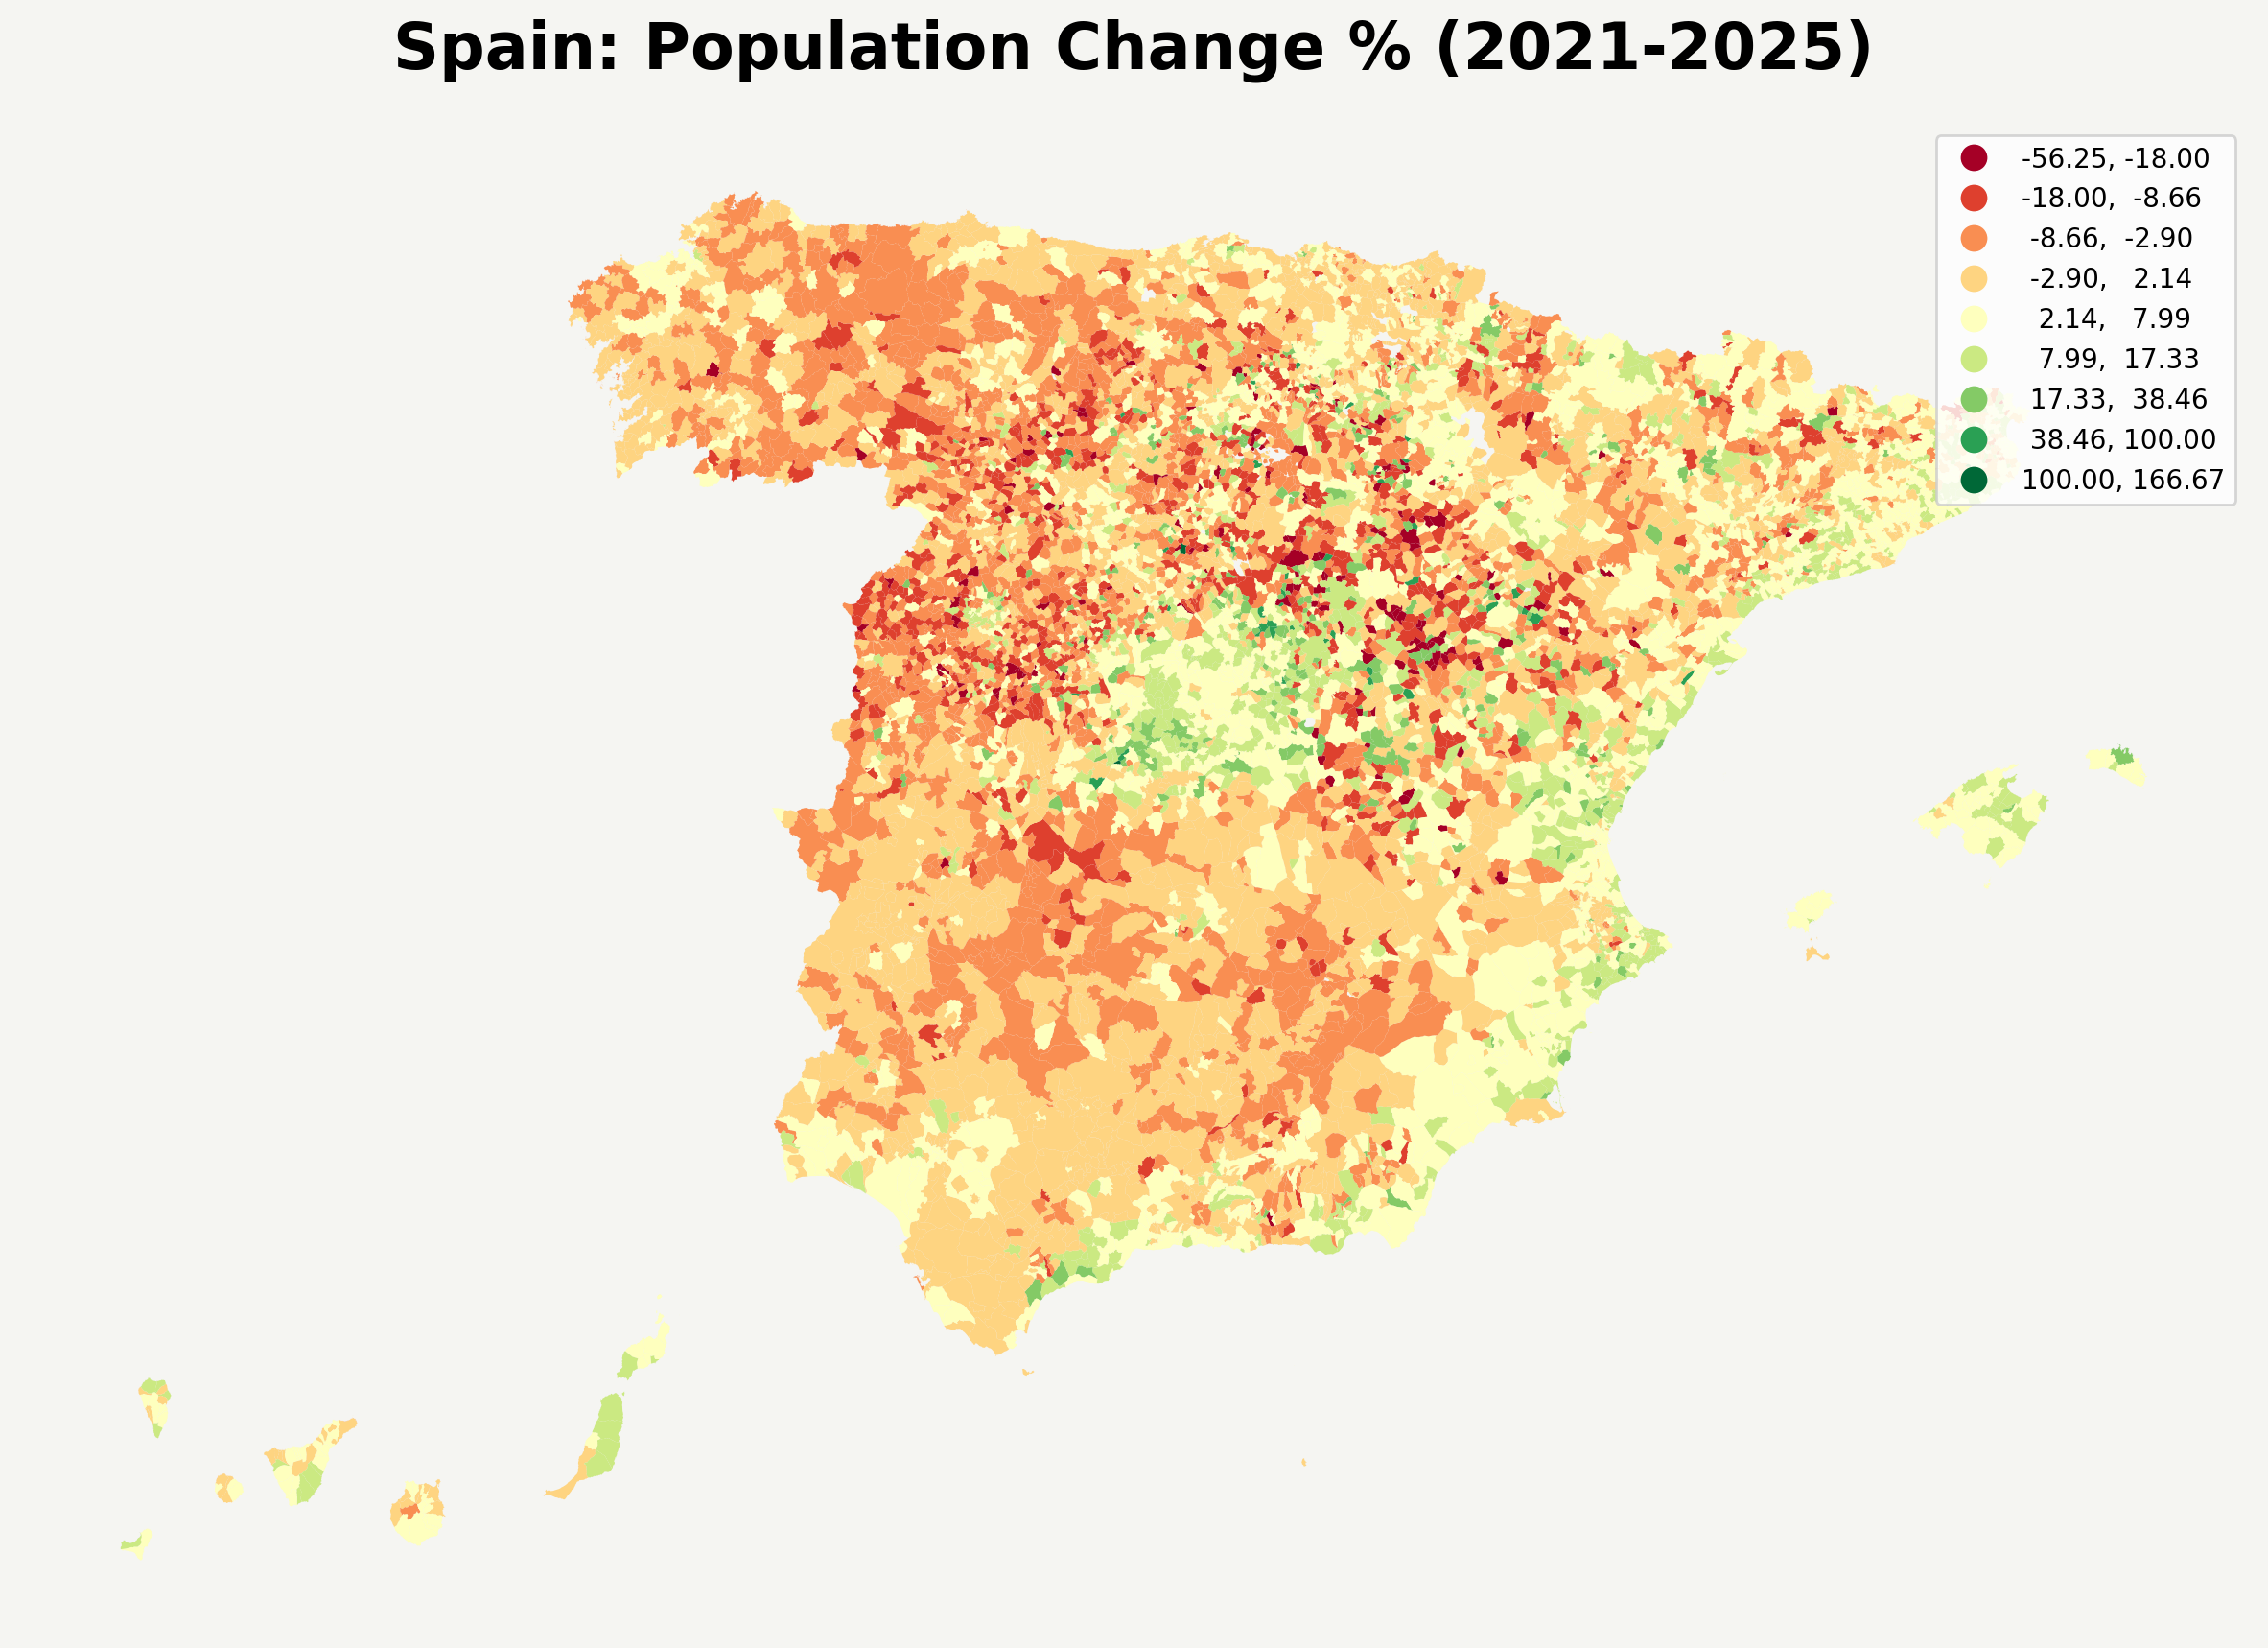
Powered with ine data (derived) which you can get here under CC4.0
wget https://raw.githubusercontent.com/gregoiredavid/france-geojson/master/communes-version-simplifiee.geojson -O france_communes.geojson
uv run calculate_french_averages.py
Calculating national averages and analyzing outliers (2024 DVF)...
Processing in chunks - please wait...

==================================================
FRANCE REAL ESTATE ROBUST STATS (2024 DVF)
==================================================
Total Sales Processed: 986,176

--- Means (Sensitive to Outliers) ---
Avg Price per m²:          16,850.34 €/m²
Avg Transaction Price:     898,225.51 €

--- Medians (Robust) ---
Median Price per m²:       2,664.19 €/m²
Median Transaction Price:  195,600.00 €

--- Percentiles ---
5th Percentile (Price):    47,500.00 €
25th Percentile (Price):    120,000.00 €
75th Percentile (Price):    325,000.00 €
95th Percentile (Price):    1,209,850.00 €
99th Percentile (Price):    15,500,000.00 €
==================================================

Generating outlier scatter plot...
Scatter plot saved as french_price_scatter.png
uv run map_french_communes.py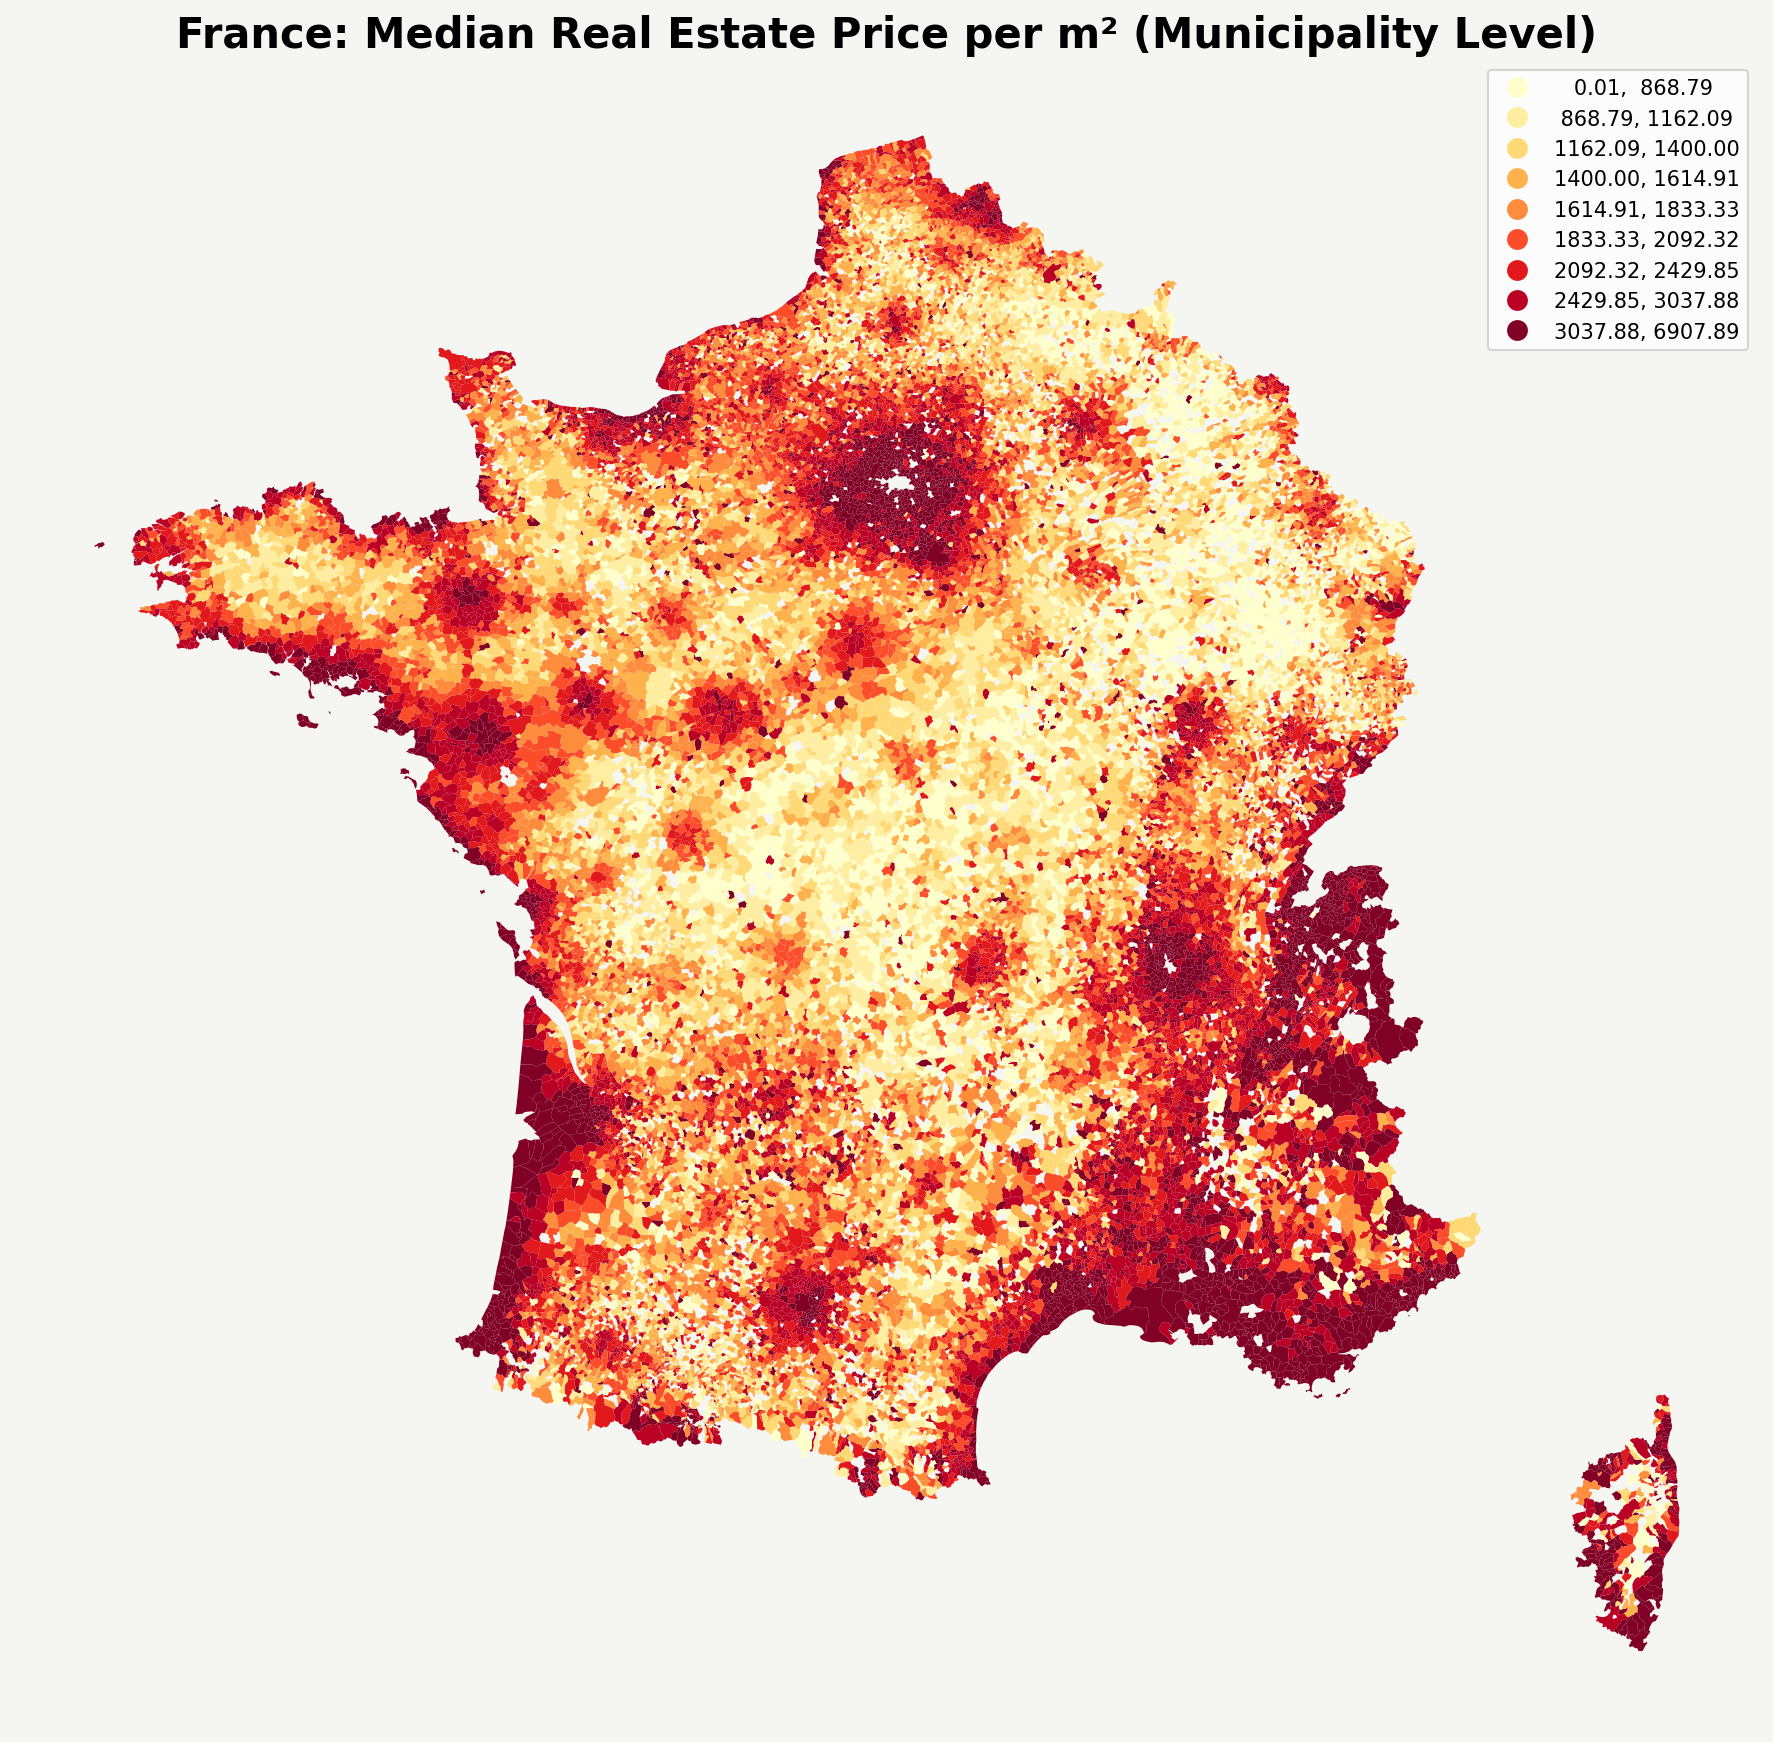
Thanks again to https://www.data.gouv.fr/datasets/demandes-de-valeurs-foncieres where you can take 5 years back of TRANSACTIONS!
Conclusions
Few years ago with the R language I enjoyed their geo capabilities.
Maps and data are cool, lets agree on that.
And in the upcoming days, I will be sharing few posts about geo + time = motion data :)
Today Ive been impressed with the French DVF with transaction property sale data per year.
The dataset is massive and can serve for learning data analytics :)
Its just a shame that data older than 5y is scrapped.
If you were expecting a post about the geometric series of improvements of LLMs, this was not your post.
But stay tuned. Because its obvious that the improvements are there.
Animated Videos
If you have read me for a while, you already know I could not avoid this:
uv run animate_spain_pop.pySo I went to pairdrop and:
And we go from: https://explore.data.gouv.fr/fr/immobilier?onglet=carte&filtre=tous&lat=46.36971&lng=2.30288&zoom=4.80
uv run animate_french_market.pyOnce again: do you see how cheap code is now?
FAQ
PL
This is the thing that triggered this post:
#git clone /eda-geospatial
cd pl
#uv init

#uv add geopandas
uv add -r requirements.txt
# Custom bounding box
python gugik_rcn_explorer.py --mode fetch --bbox "20.9,52.1,21.1,52.3" --layer ms:transakcje

# See all city shortcuts
python gugik_rcn_explorer.py --list-cities
Just that data gathering…seems to be slow.
DK takes it to the next level
I was impressed years ago with the ‘gob BI’ in Denmark.
And they have keep it up: https://www.dst.dk/en
Specially compared with the UI/X of the other options we have seen.
In fact, DKK publish their statistical data via R packages.
Its interesting to see inflation going down, despite same wars that caused it are still going on:
- Overview - https://www.dst.dk/en/Statistik/temaer/overblik-dansk-oekonomi
- The avg Dane - https://www.dst.dk/en/Statistik/laer-om-statistik/gennemsnitsdanskeren
- Some map with abg price of m2: https://rkr.statbank.dk/statbank5a/Graphics/mapanalyser.asp?maintable=BM010&lang=1 coming from https://rkr.statbank.dk/BM010
Interesting to see that MEDIAN net assets are ~1y+ of earnings before tax
Also interesting to see a higher inflation of 0.8% than the gdp growth 0.2%
cd dk && uv run animate_dk_pop.py
uv run animate_dk_pop_delta.py
uv run animate_dk_pop_pct.py
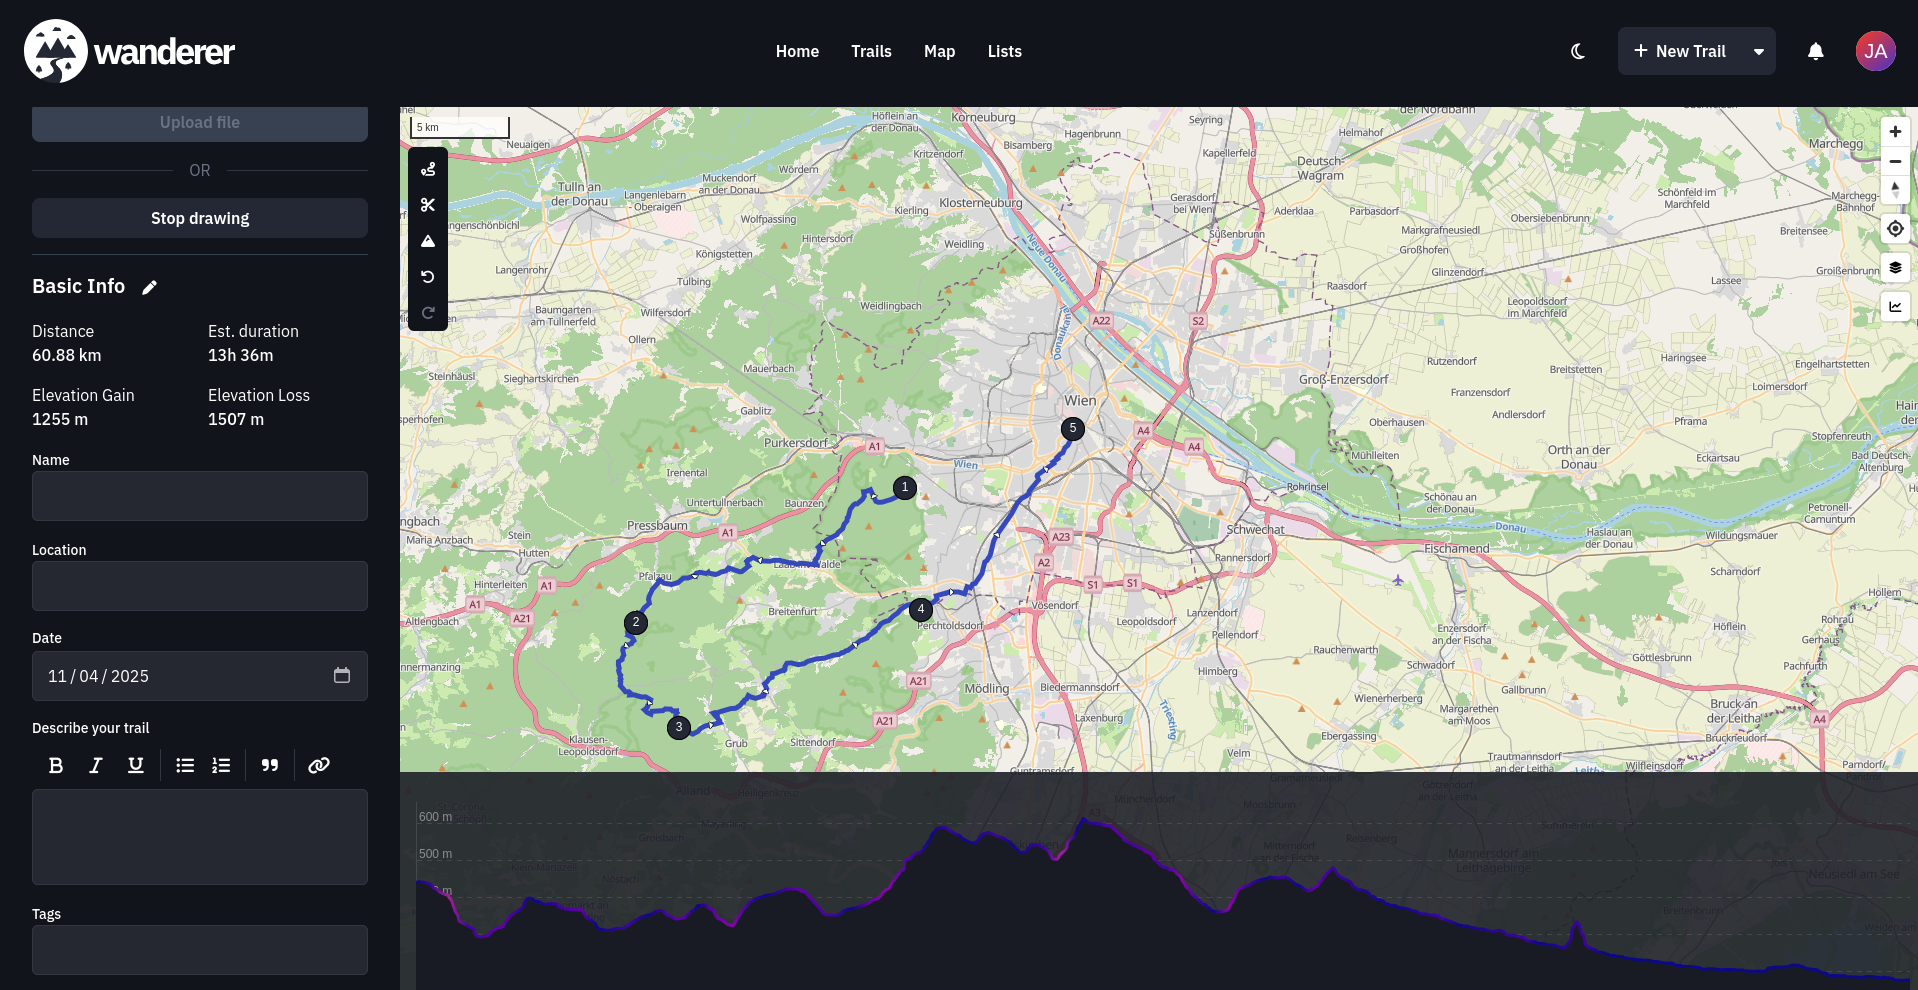
uv run animate_dk_pop_pct_ytshort.pySelfhosted GPX?
As you might know, gpx is great.
tess1o/geopulse: A self-hosted, privacy-first location tracking platform. The perfect open-source alternative to Google Timeline with automatic trip detection, Immich integration, and detailed analytics.