Geospatial Data Tricks and a GoPro!
TL;DR
Playing with a GoPro video metadata (EXIF extraction) after karting.
GeoSpatial Data Formats
There are few data forms to save geolocation data.
I have tried:
 Tinkering with Animations | Post
 RouteTracker Repo
GeoJSON
With R language I learnt about many other formats.
One of them was GeoJson.
GPX
While riding bikes, I got to know GPX format.
Phone apps like Komoot or even PhyPhox can save the GPS records as GPX files
And GPX files can be converted to html with plotly+leaflet and brought to your HUGO site with iframe:
GoPro Metadata Extraction
There are some official programs:
Parser for GPMF™ formatted telemetry data used within GoPro® cameras.
But I had for fun with the ExifTool and the Route tracker repository:
GPLv3 | ExifTool meta information reader/writer
People do this kind of cool stuff:
Garmin VIRB Edit
Garmin VIRB Edit, which works for Windows and does not work out of the box for Linux:
Telemetry Overlay
There is a possibility to use paid Programs to create these kind of videos:
Exif and Python with GoPro
We can extract Go Pro Metadata with this simple CLI tool in Linux:
sudo apt-get install libimage-exiftool-perl #install exif
#exiftool -ee ./GX030390.MP4 #you will see it on CLI
exiftool -ee ./GX030390.MP4 > output-GX030390.txt #saves it
And now you got a .txt with all the information, ready to get it analyzed with python.
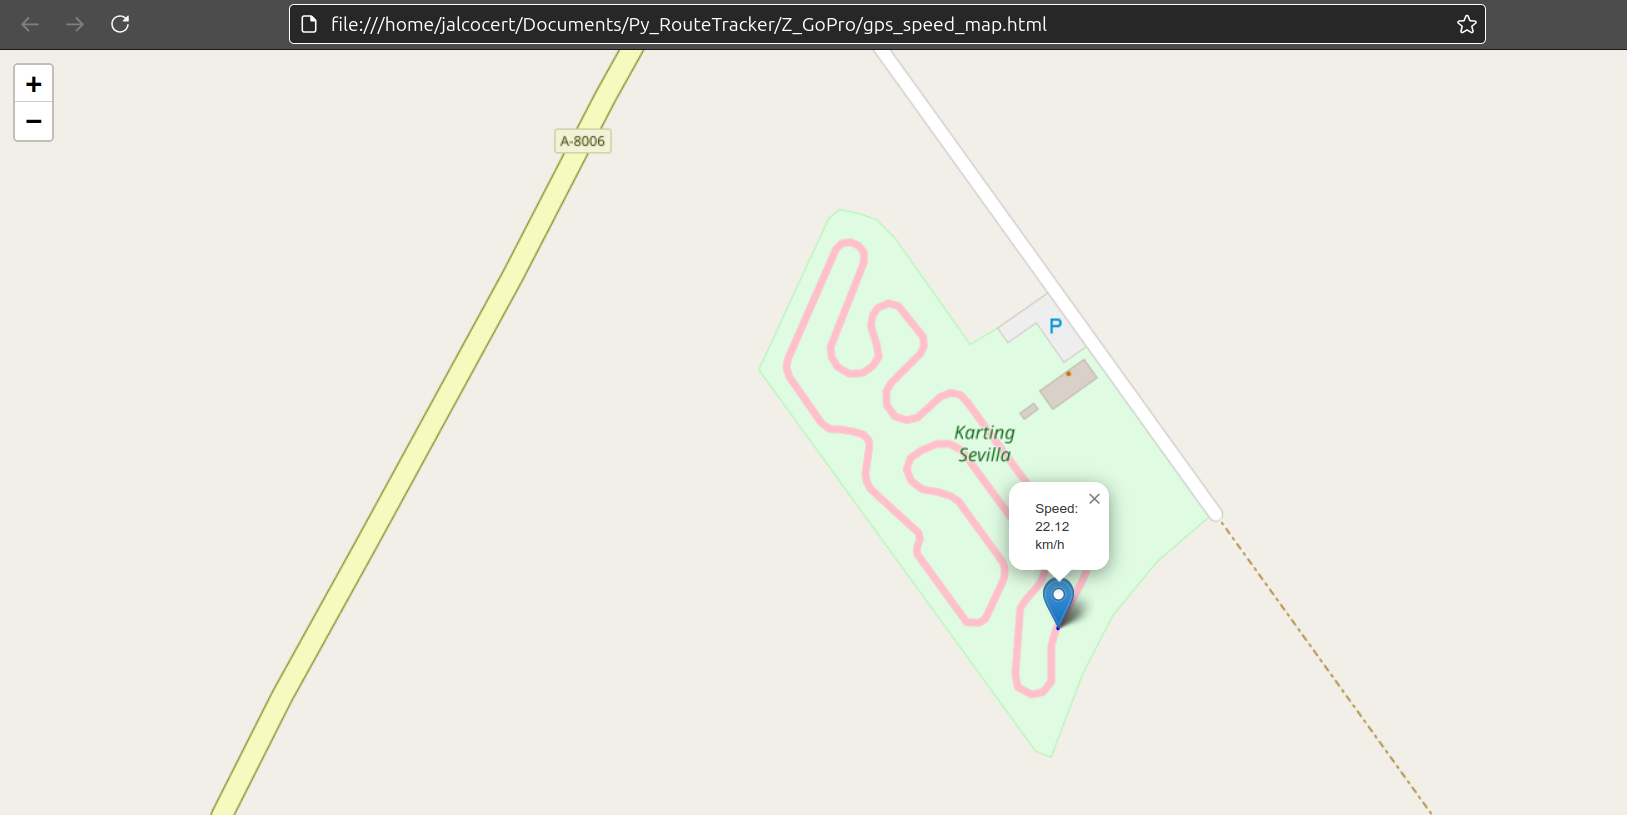
Extracting Location Data from GoPro MP4
For this kind of videos, can be done as per the notebook.
The GoPro provides ~10Hz GPS information.
![]()
Extracting Speed Data from GoPro MP4
You can just do:
sudo apt-get install libimage-exiftool-perl
exiftool -ee ./GX030390.MP4 #adapt as per your GoPro file name
#exiftool -ee ./GX030390.MP4 > output.txt
And Plotly, to get such map graphs from the GoPro:
PhyPhox Data Extraction
Hey, but why would you want to…
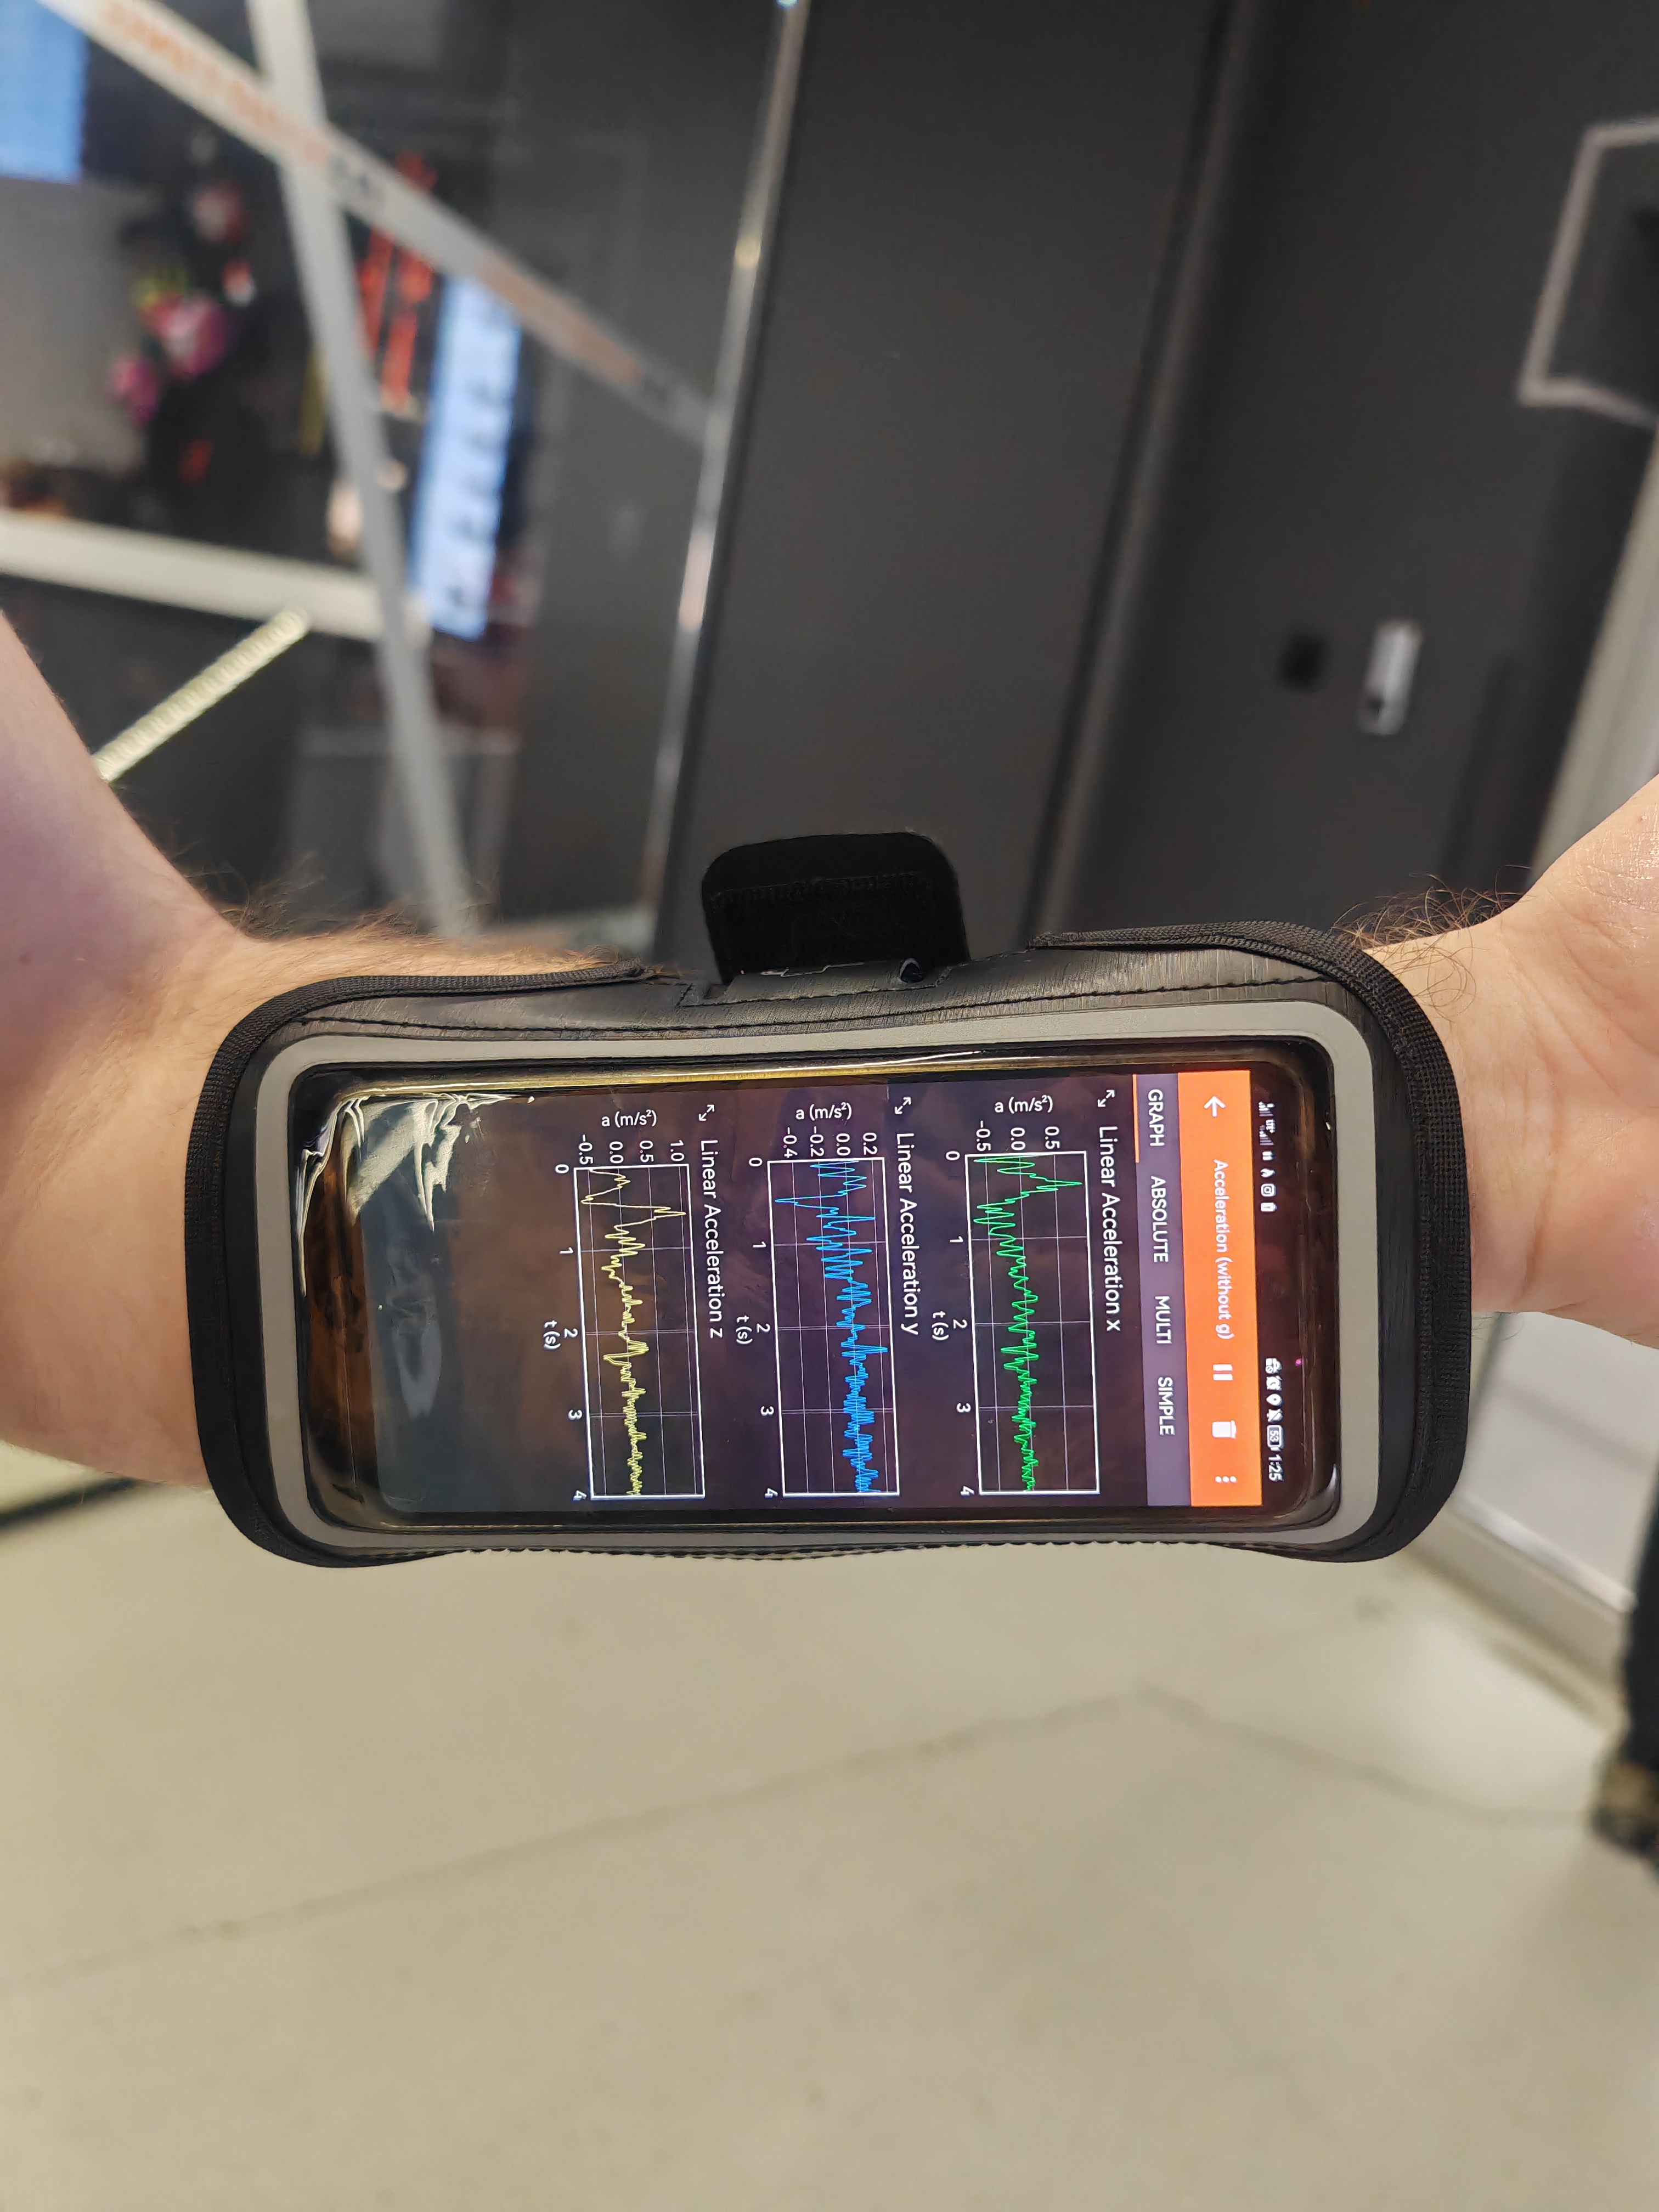 PhyPhoxRoute Tracker on Github
You can even see what happens when a plane takes off:
Polar Data Extraction
You can try the Polar Devices Metadata extractions:
You can also open it with: ![]()
 Polar DataRoute Tracker
FAQ
DJi Metadata Extraction
The DJi OA5Pro does NOT have a GPS.
Videos can look like this one, with an interesting image quality:
Im now using rsync to move the big video files:
#cp *.MP4 /home/jalcocert/Desktop/oa5pro/
rsync -avP *.MP4 /home/jalcocert/Desktop/oa5pro/ #speeds of ~32mb/s from internal card!
#rsync -avP *.MP4 /media/jalcocert/Backup2TB/DJI-OA5Pro #copy it to an external SSD

#rm *.LRF #clean (if needed) all LRF files
Learn with this one
Video to Image to GIF
How about: extracting images from a video…and making a gif with them?
The choice between PNG and JPG depends on the trade-off between image quality and file size:
- From a timeframe until the end, 1 frame:
#from second 90 of the video, give me 1fps
ffmpeg -i DJI_20250116072852_0036_D.MP4 -vf "select='gte(t\,90)',fps=1" -vsync vfr frame_%03d.png
ffmpeg -i DJI_20250116072852_0036_D.MP4 -vf "select='gte(t\,90)',fps=1" -vsync vfr frame_%03d.jpg- Use PNG if you need high-quality, lossless images.
- Use JPG if you want smaller file sizes and are okay with slight quality loss.
- And just between 90s and 105s timeframe, 1fps:
ffmpeg -i DJI_20250116072528_0035_D.MP4 -vf "select='between(t,90,105)',fps=1" -vsync vfr frame_%03d.pngThis is an interesting way to generate Images for YT Videos!
More power is good BUT
But!
Speed wont increase that quick.
Its all about physics.
Remember that the kinetic energy of a body goes as: $KE = \frac{1}{2}mv^2$
The relationship isn’t linear, so these percentages describe the change but don’t explain the why behind the change (as discussed in the previous response about non-linear relationships).
Let’s break down the relationship between force, acceleration, power, and kinetic energy using KaTeX for the equations.
Newton’s second law of motion states: $F = ma$
where:
Fis the force applied to the objectais the acceleration of the object (the rate of change of velocity)
Power (P) is defined as the rate at which work is done, or the rate at which energy is transferred.
When a force is applied to an object and causes it to move, work is done.
Power can be expressed as: $P = Fv$
where v is the instantaneous velocity of the object.
So more power, gives you a higher force (to keep accelerating), at a given speed.
The work-energy theorem states that the work done on an object is equal to the change in its kinetic energy.
When a force causes an object to accelerate, it does work on the object, and this work appears as an increase in the object’s kinetic energy.
Let’s consider a small change in kinetic energy (dKE) due to a small change in velocity (dv). We can differentiate the kinetic energy equation:
$$ d(KE) = d(\frac{1}{2}mv^2) = \frac{1}{2}m(2v , dv) = mvdv $$
Now, we know that acceleration a is the rate of change of velocity with respect to time: a = dv/dt. Therefore, dv = a dt. Substituting this into the equation above:
$$ d(KE) = mv(a , dt) = (ma)v , dt $$
Since F = ma, we have:
$$ d(KE) = Fv , dt $$
The change in kinetic energy (dKE) over a small time interval (dt) is equal to the force (F) times the velocity (v) times the time interval (dt).
Notice that Fv is the power (P). So, we can write: $d(KE) = P , dt$
This equation tells us that the change in kinetic energy is equal to the power applied multiplied by the time interval over which the power is applied.
Integrating both sides with respect to time gives the total change in kinetic energy:
$$ \Delta KE = \int P , dt $$
If the power is constant over a time interval Δt, then:
$$ \Delta KE = P \Delta t $$
The change in kinetic energy is equal to the work done, which is equal to the power applied multiplied by the time interval.
Calculations:
- Percentage Change = (New Value - Old Value) / Old Value * 100%
1. 390cc 15 cv (77 km/h) to 390cc 18 cv (80 km/h):
- Power Increase: (18 - 15) / 15 * 100% = 20%
- Speed Increase: (80 - 77) / 77 * 100% ≈ 3.9%
2. 390cc 15 cv (77 km/h) to 460cc 22 cv (88 km/h):
- Power Increase: (22 - 15) / 15 * 100% ≈ 46.7%
- Speed Increase: (88 - 77) / 77 * 100% ≈ 14.3%
3. 390cc 18 cv (80 km/h) to 460cc 22 cv (88 km/h):
- Power Increase: (22 - 18) / 18 * 100% ≈ 22.2%
- Speed Increase: (88 - 80) / 80 * 100% = 10%
Summary Table:
| Comparison | Power Increase (%) | Top Speed Increase (%) |
|---|---|---|
| 15 cv to 18 cv (same cc) | 20 | 3.9 |
| 15 cv to 22 cv (different cc) | 46.7 | 14.3 |
| 18 cv to 22 cv (different cc) | 22.2 | 10 |
You can see there 6 cyl goes to 325 and 5 cyl goes up to 304km/h (6% diff)
Important Reminder:
These percentage increases show the change in power and speed, but they do not imply a direct, proportional relationship.
Factors like aerodynamic drag, gearing, weight, and other variables play a crucial role, especially at higher speeds.
The smaller speed increase from 15 cv to 18 cv illustrates this point—even with a 20% power increase, the speed gain was relatively small due to the influence of these other factors.
Also, these are top speed at different days, by different drivers.
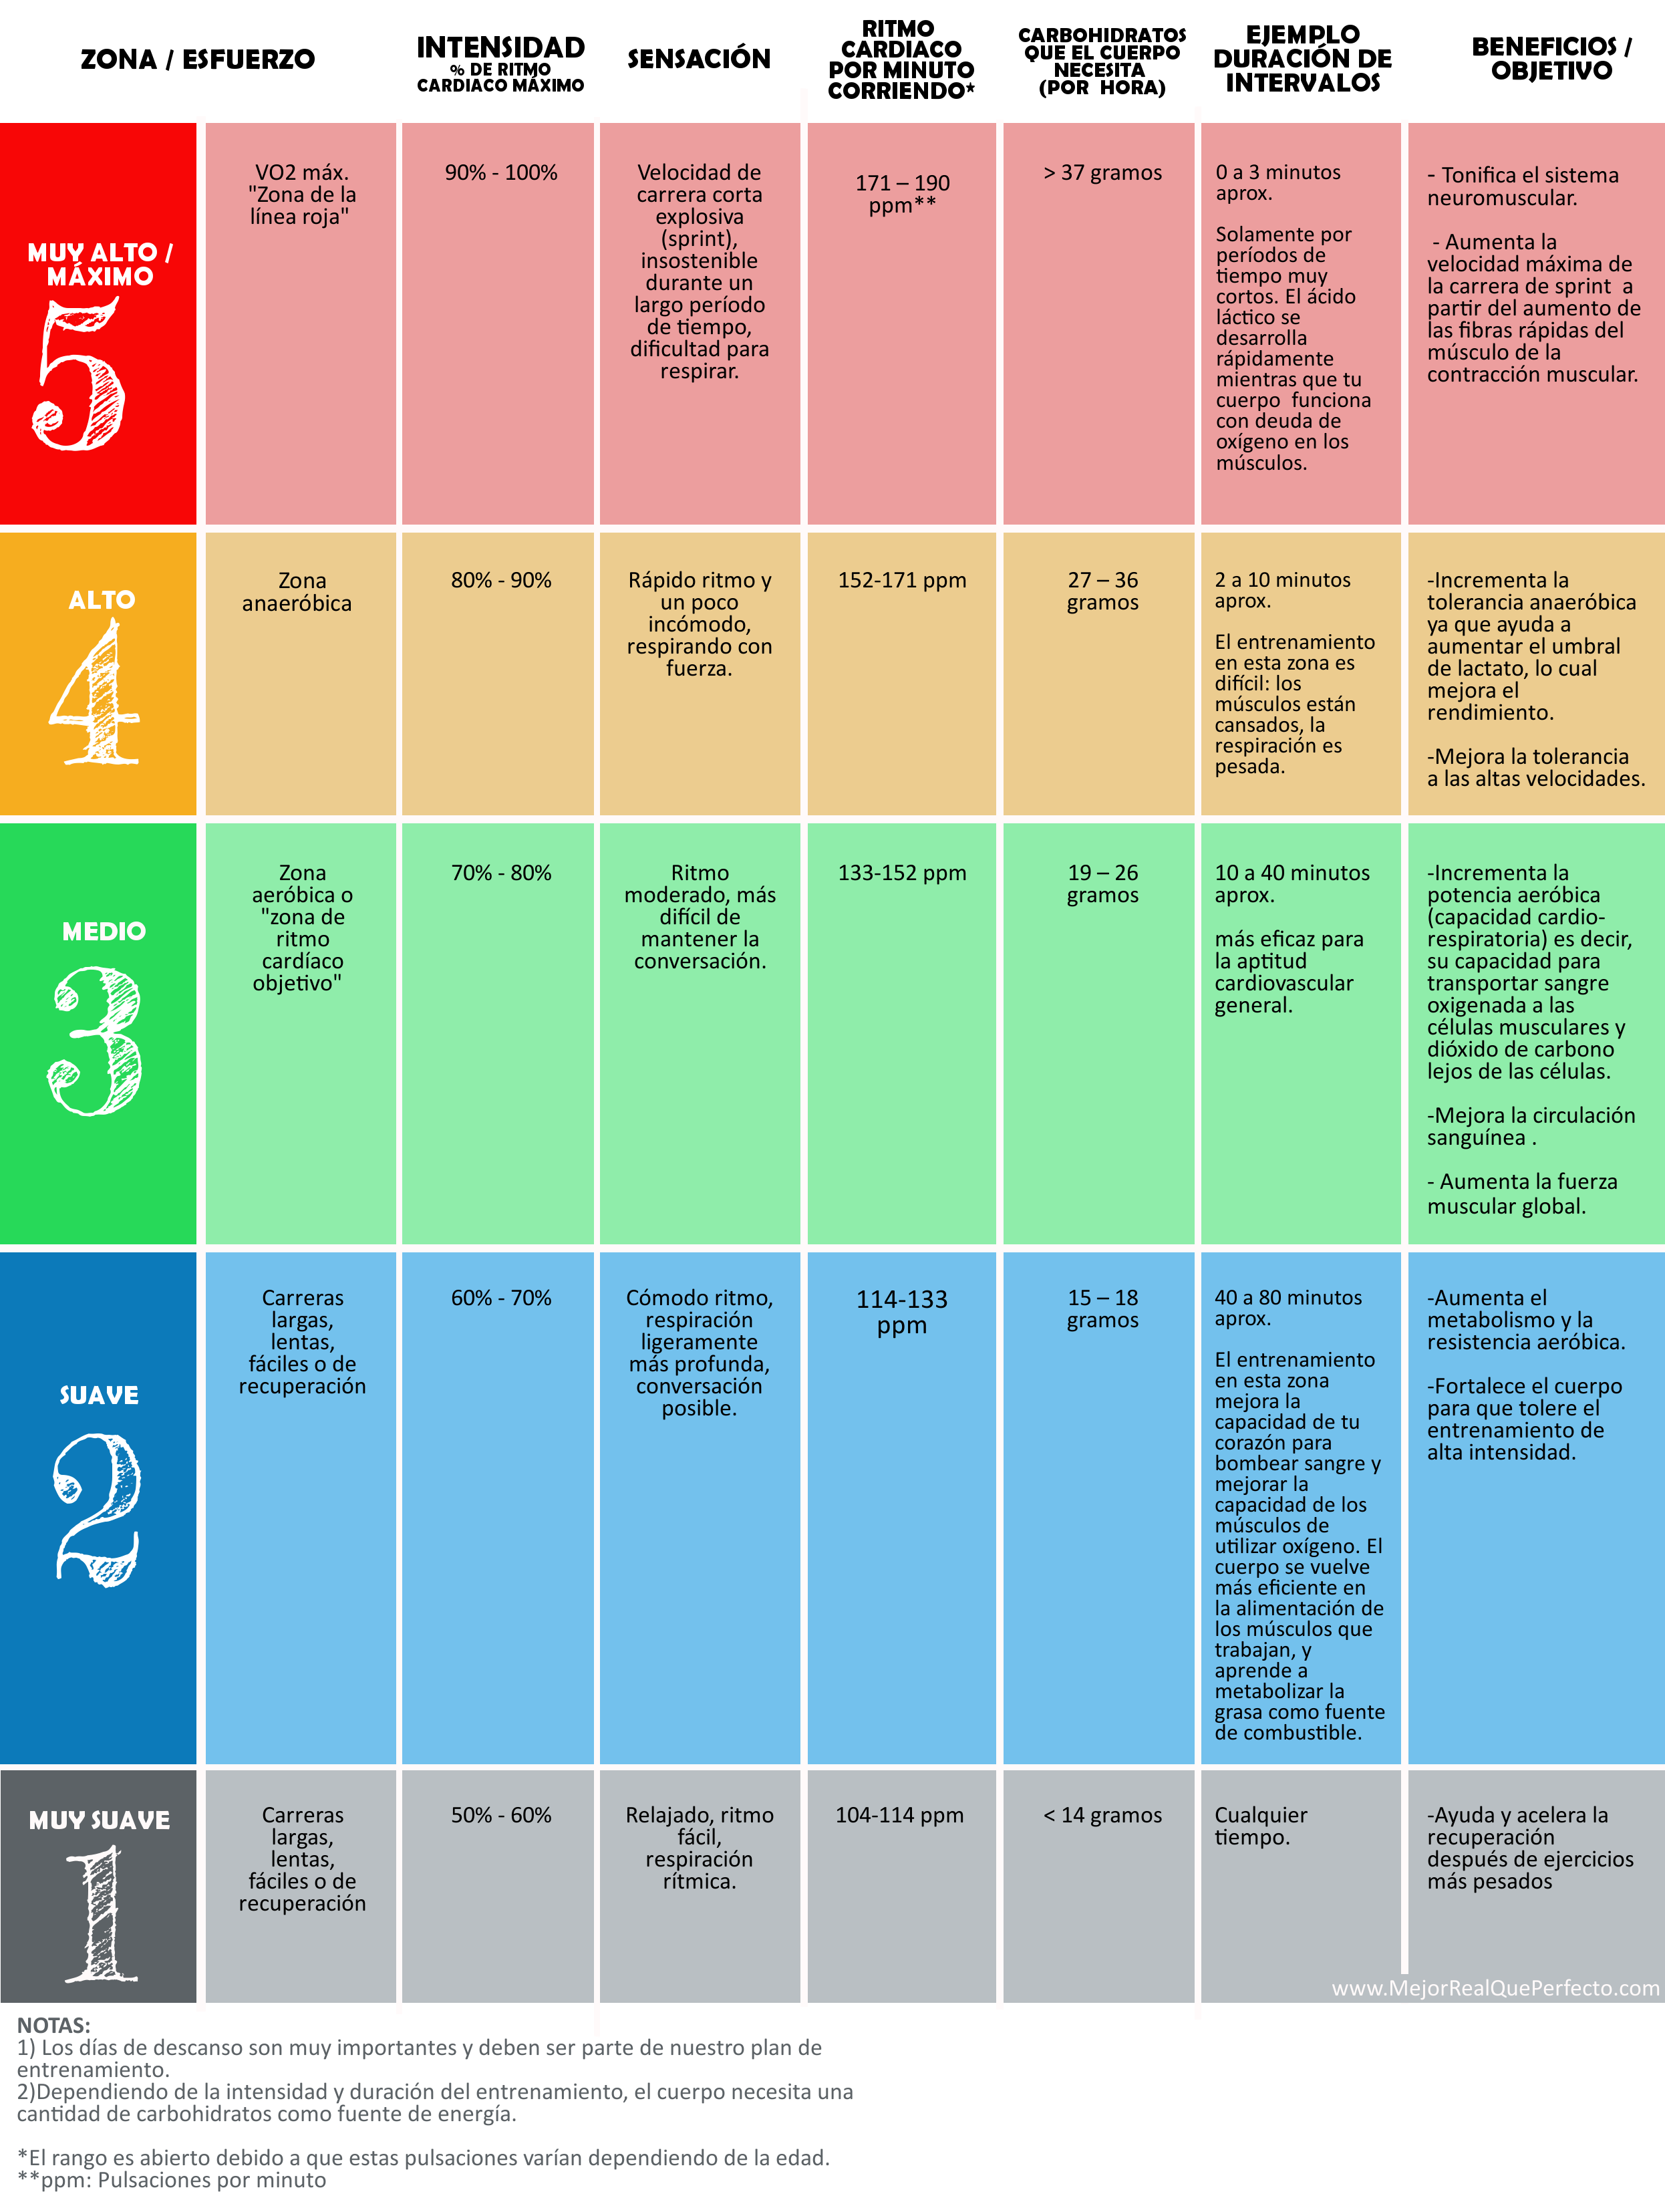
Lower temperatures can benefit lap times due to increased engine power, but it’s crucial to consider tire temperature.
The optimal temperature for the best lap times is a balance between these two factors and can vary depending on the track, kart setup, and driver skill.