How to create and deploy Flexdashboard with R
R Flexdashboards
Flexdashboards are a powerful tool for creating dynamic, interactive dashboards within R.
Developed by RStudio, they leverage the infrastructure of R Markdown to allow users to build robust visual displays of information.
Flexdashboards support a variety of visual outputs, including tables, data frames, plots, and even more advanced interactive visualizations using packages such as plotly and leaflet.
The strength of Flexdashboards lies in their simplicity and ease of deployment.
They use a simple markdown syntax, which makes it easy to layout and design the dashboard. They can be rendered as standalone HTML documents, which can be easily hosted on a variety of platforms, including GitHub Pages.
This makes Flexdashboards an excellent choice for static reporting and when sharing insights with an audience that does not require real-time interaction with the underlying data.
Flexdashboards are static dashboards - this means that they can be hosted like a static web page on Github pages, Gitlab pages…
Using Flexdashboards for the first time
You need the R language installed:
sudo apt update
sudo apt install r-base #this is ~150mb to get installed
sudo apt install pandoc #and this around ~200mb
See that R is ready with:
R --versionYou will need to install the flexdashboard package in R:
R #lets get into R CLI
install.packages("flexdashboard")

#remotes::install_github('rstudio/flexdashboard')
To author a flexdashboard you create an R Markdown document with the flexdashboard::flex_dashboard output format: its all about the.Rmd
You can do this from within RStudio using the New R Markdown dialog.
But you can also get started with vscode.
- Example one - Just getting started with Flexdashboards:
---
title: "My First Flexdashboard"
output: flexdashboard::flex_dashboard
---

Column {data-width=650}
-------------------------------------

### Plot of Cars Data
```{r}
# Basic plot using the 'cars' dataset
plot(cars)
Now, we just need to run the script, so that the html gets renderd (knitted actually!)
Rscript -e "rmarkdown::render('my_dashboard.Rmd')"Now you can quickly see the result by opening the html file, or by:
python3 -m http.server 8000 #or 8001 if thats taken...There yo go, the flexdashboard is posted at http://localhost:8001/my_dashboard.html
You can add these as part of static sites post (like this one) as iframe.
Just remember to include the file a /public/my_dashboard.html and then just call it:
<iframe
  src="/my_dashboard.html"
  width="100%"
  height="800px"
  frameborder="0">
  Your browser does not support iframes.
</iframe>- Let’s create another Markdown file (I like to call it
index.Rmd), that will be the one containing the logic of our flexdashboard:
---
title: "Flex Dashboards"
author: JAT
output:
  flexdashboard::flex_dashboard:
    orientation: column
    vertical_layout: fill
    source_code: embed
runtime: shiny
---
To test the changes that you are performing to the index.Rmd file, you will need to use the following commands in R:
#wd<-dirname(rstudioapi::getActiveDocumentContext()$path)
#setwd(wd)

rmarkdown::run("index.Rmd", shiny_args = list(port = 3838, host = "0.0.0.0"))
With this command, a new window will be displayed were you can interact with the dashboard locally.
When you will be done with the changes, you can generate the HTML content that will get displayed on the Github Page:
rmarkdown::render_site("index.Rmd")I Like to have those in a specific file Flexdashboards.Rmd to make easier the workflow.
After completion, you will see a new /docs folder containing the dashboard that will get displayed at Github.
Remember that you will need to install R dependnecies:
sudo apt-get install libgdal-dev libproj-dev libgeos-dev

R
#install.packages("leaflet")
install.packages("sf")      # Simple Features package for spatial data
#install.packages("leaflet", dependencies = TRUE)

install.packages("remotes")
remotes::install_github("rstudio/leaflet")
remotes::install_github("ropensci/plotly")

q()
You will see a .Rhistory file with the steps you made:
install.packages("terra")
install.packages("leaflet", dependencies = TRUE)

install.packages("sf")      # Simple Features package for spatial data
install.packages("remotes")
remotes::install_github("rstudio/leaflet")
q()
remotes::install_github("ropensci/plotly")
q()
How to Customize a Flexdashboard
There are great sources for ideas, I would start with:
- https://pkgs.rstudio.com/flexdashboard/articles/layouts.html
- https://plotly.com/r/
- https://r-graph-gallery.com/
Flexdashboard Example - Open Data Analysis
You can explore one example that I created.
That one is a litle bit more advanced.
They have separated tabs to showcase different use-cases examples:
Map
Interactive line chart
3D Scatter plot
You can use it in the Github Page link: https://jalcocert.github.io/R_is_Great/
- And check the code to get ideas at: https://github.com/JAlcocerT/R_is_Great/tree/main/Flexdashboards
See how to organize flexdash - https://rstudio.github.io/flexdashboard/articles/using.html
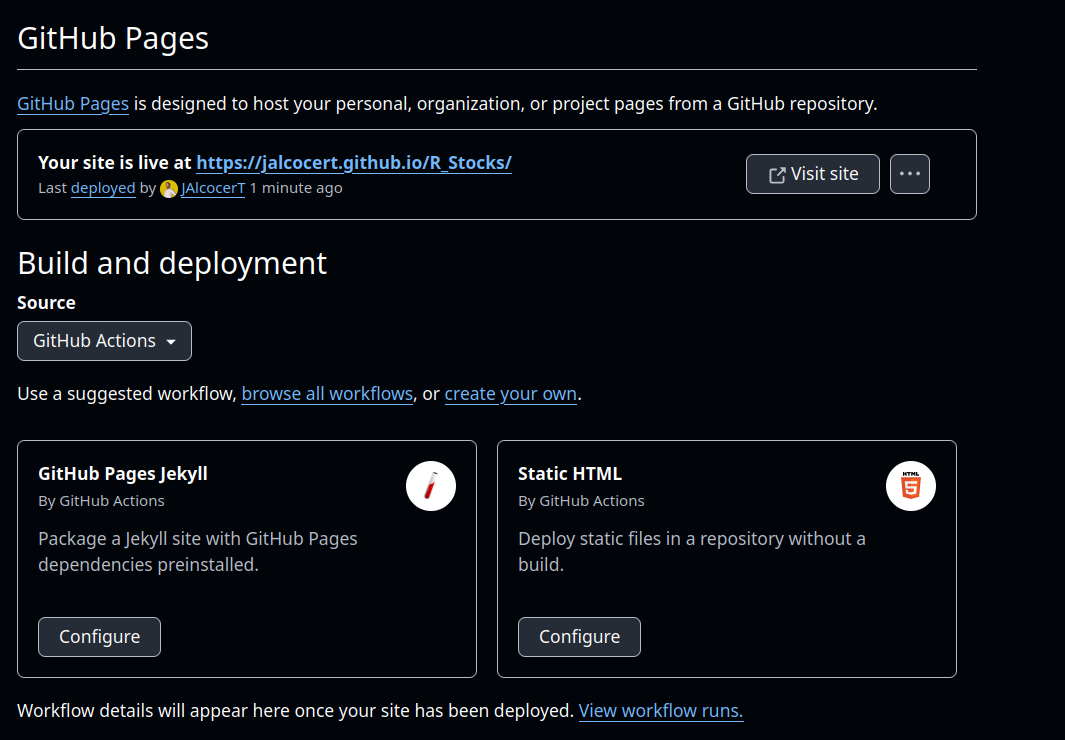
Deploying Flexdashboards to Github Pages
You can generate the flexdashboard to html (knit it), by pressing CTRL+SHIFT+K.
When it finishes, you can see a .html file with the same name of your .Rmd
Rename it to index.html, place it on /root and activate the github actions static deploy
FAQ
Ive been playing with ~/Documents/cyclingthere/z_my_dashboardv2.Rmd or R_Flexdashboards_Cycles.Rmd.
Other Ways to Present Data with R
How about Shiny?
Shiny is another product from RStudio that offers a framework for building interactive web applications entirely in R.
Shiny is more flexible than Flexdashboards and can create more complex and interactive applications.
Shiny allows for real-time interaction, meaning that the user’s inputs can directly affect the output, and the output is updated immediately.
This is ideal for creating dashboards where users may want to filter, slice, or manipulate the data to answer different questions.
However, Shiny requires a running R session in the background, which makes hosting a bit more complex compared to Flexdashboards.
Shiny apps can be hosted using Shiny Server or RStudio’s hosting service, ShinyApps.io.
How to create animations in R
Would not be cool to do such things?
Or these ones?
Other F/OSS Static Data Driven Stuff
With these, we can crete mpactful Data Driven Presentations:
- Marp
- RevealJS