Server Monitoring [Recap]. Know your hardware' Health
Intro
Recently I was setting a VPS to software for weddings.
And i found this on reddit - https://www.reddit.com/r/selfhosted/comments/1eb4bi5/i_just_released_beszel_a_server_monitoring_hub/
So I went back to the VPS provider https://console.hetzner.cloud/projects to try the setup.
Beszel
MIT | Lightweight server monitoring hub with historical data, docker stats, and alerts.
Following the docs - https://beszel.dev/guide/getting-started
Then, you will create the admin user at first login.
And you will be at this point:
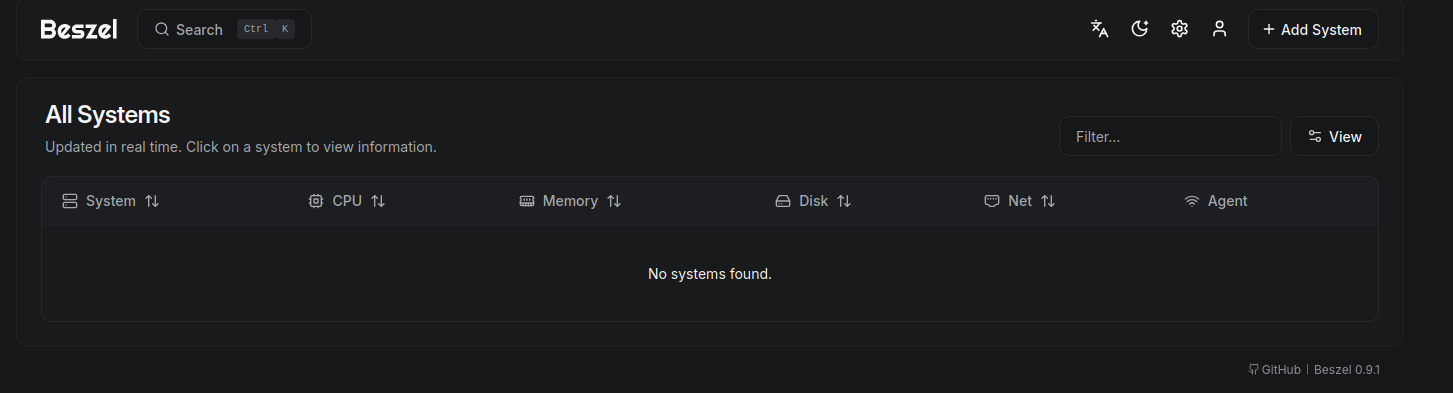
From where you can add the first PC to monitor
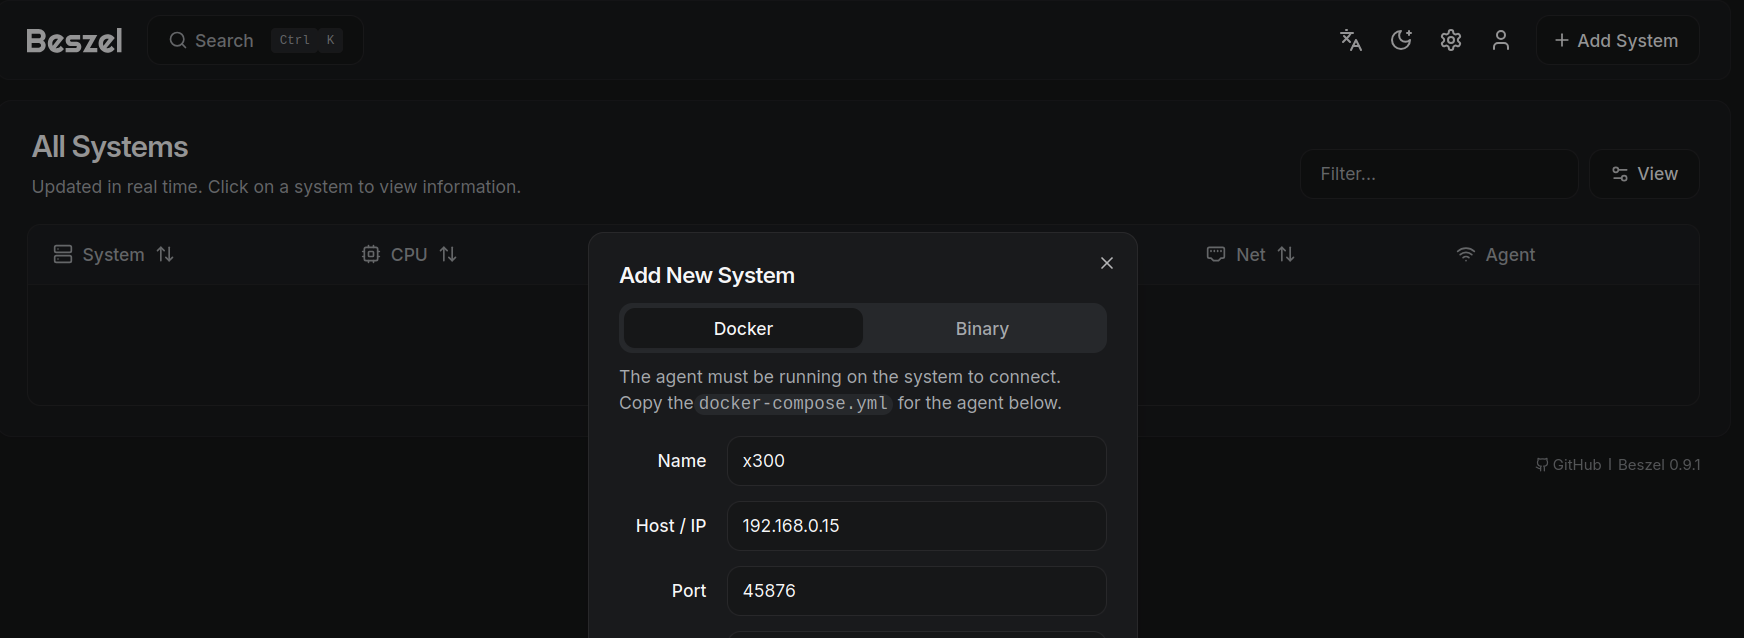
See how DBTech does the full process:
And you can add the agent as CLI (instead of a docker service):
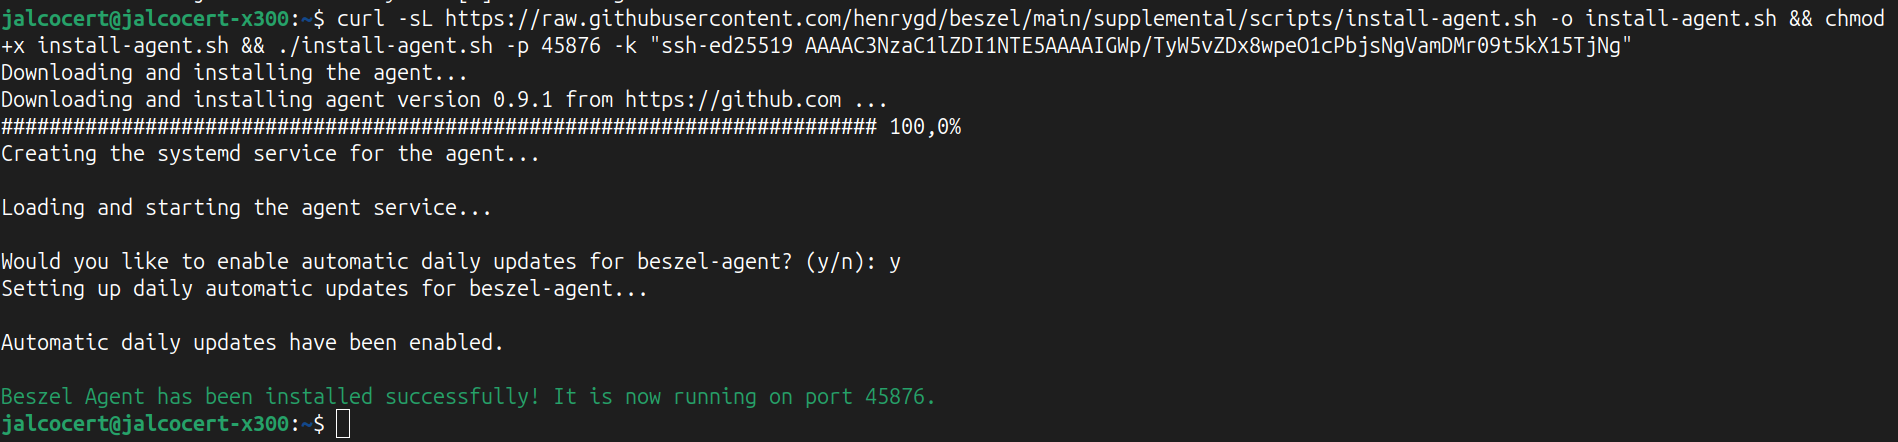
192.168.0.12)
Other Monitoring Solutions
Tianji
Its not just a web analytics tool!
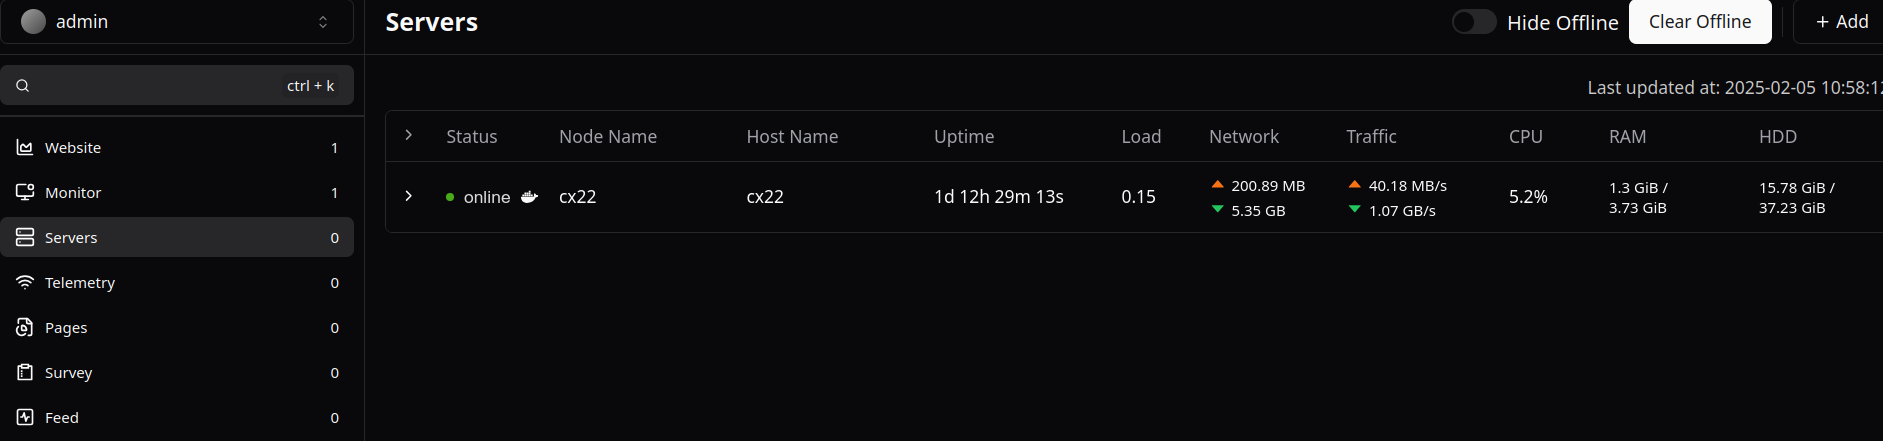
You just need to setup the given script on your server that pops up when you try to add it.
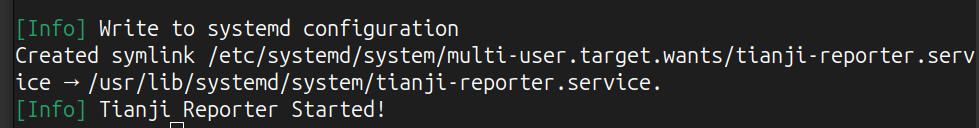
To stop Tianji:
systemctl --type=service --state=running
# sudo systemctl stop tianji-reporter.service
For just web analytics:
Netdata and Grafana
My first monitoring at the homelab were possible thanks to:
And you can actually use Netdata + Grafana + Prometheus to make a cool monitoring setup:
Internet Monitoring Tools
- With a Raspberry Pi
- Internet Speed Tracker
- WatchYourLan Setup
- Gatus - OSS website monitoring!
- https://akashrajpurohit.com/blog/monitor-internet-speed-with-speedtest-tracker/