How to analyze Business Opportunities
Tl;DR
Business are games, with defined rules.
Get to know them to potentitally win.
Intro
Sometimes things dont work because you need to do more.
More Volume, repetitions, getting unconfortable.
Other times, its just about…get started.
flowchart LR
    %% Styles
    classDef state fill:#E3F2FD,stroke:#1565C0,stroke-width:2px,color:#0D47A1;
    classDef start fill:#43A047,stroke:#1B5E20,stroke-width:2px,color:white;

    %% Nodes
    Start((Start)):::start --> More
    More(Doing MORE):::state
    Better(Doing BETTER):::state
    Newer(Doing NEWER):::state

    %% Internal Feedback Loops (The Grind)
    More -- "Scale Up" --> More
    Better -- "Refine" --> Better
    Newer -- "Test" --> Newer

    %% The Progression Journey
    More -- "Capacity Hit" --> Better
    Better -- "Optimized" --> Newer

    %% The Upward Spiral
    Newer -- "New Baseline" --> More
But how to assess if you will be starting a non-sense journey to a path that goes nowhere?
Despite the fact that The How is now more for agents and abstracted, why should you loose time?
This all got initiated after going to the wall several times.
And thanks to asking unconfortable questions for which I have no replies here and here
Business Idea Checklist
Dont even dare to start if you dont have these cristal clear.
Someone coming to you for collaborations and partnerships?
Tell them to send you these filled up.
It works even better if they do so programatically via forms
Is it a new product that needs evangelization?
- Existing competitors? or Needs PMF test?: Would recommend to go for No need of PMF, demand validated.
- Example: No need of PMF, demand validated.
Who is your client (buyer persona) and how it will get to know you?
- The BANT context
Value proposition: this must be clear for you, also in the landing
- The value eqution: How much value you promise x % of happening / ( Time 2 value * Effort to get there )
The ICP focuses on the ideal company or customer segment, the value proposition communicates why the product matters, and the customer avatar embodies the individual persona within the ICP that marketers and sales teams aim to reach.
The “Puddle” must fit the 4 Indicators (Pain, Money, Targetable, Growing).
The launch strategy: aka, focus strategy
| Element | Decision |
|---|---|
| One Avatar | |
| One Product | |
| One Channel | One of the ,Core-4’: Warm OutReach / Free Content / Cold OutReach / Paid Ads |
| The Lead Magnet | Strategy Type: , Delivery Method: |
mindmap
  root((Hormozi Business Engine))
    (Tactics: $100M Leads)
        [The 3 Strategic Types]
            Reveal the Problem :: Diagnosis
            The Sample :: Trial
            Step 1 of N :: First Step
        [The 4 Delivery Methods]
            Software :: High Value Tools
            Information :: PDF/Video/Webinar
            Service :: Free Audits/Consults
            Physical :: Samples/Books
        [The 7-Step Process]
            1. Define the Problem
            2. Define the Solution
            3. Choose Delivery Method
            4. Name the Magnet
            5. Create the Value
            6. Test the Title
            7. Distribute
    (Strategy: $100M Money Models)
        [The 4 Offer Types]
            Attraction :: Lead Magnets & SLOs
            Core Offer :: The Primary Solution
            Upsell :: Increased Value/Speed
            Continuity :: Recurring Revenue
        [Psychological Tools]
            The Salted Pretzel :: Problem/Solution Cycle
            Decoy Offer :: Anchoring Value
            Goodwill :: Giving the Secrets
        [Economic Goals]
            Client Financed Acquisition :: CFA
            Self-Liquidating Offers :: SLO
            Zero Cost Per Lead
Expand it here.
You have to look at the “Lead Magnet” and the “Offer” as two gears in the same machine.
A Lead Magnet is about finding the person; the SLO is about funding the search.
Here is the breakdown of the types and how they plug together.
- The 3 Functional Lead Magnet Types
According to $100M Leads, every effective magnet fits into one of these three categories:
| Type | How it Works | Example | Best Pair with (Offer) |
|---|---|---|---|
| Reveal the Problem (Diagnosis) | Show them a hidden pain they didn’t know they had. | Website Speed Test, Posture Assessment, Credit Score Check. | Implementation Services: “We found 10 errors; pay us to fix them.” |
| The Sample / Trial | Give them a “taste” of the actual solution. | Costco sample, 7-day Gym Pass, Free First Chapter. | Continuity / Subscription: “Enjoyed the week? Join the monthly membership.” |
| Step 1 of N (The First Step) | Solve the first micro-problem of a complex process. | A “House Cleaning Checklist” for someone wanting to sell their home. | High-Ticket Core Offer: “Now that the house is clean, let us handle the $20k staging/sale.” |
- Delivery Formats (How they get it)
Once you pick the type of magnet, you choose the vehicle:
- Software: Calculators, spreadsheets, or mini-apps (the most valuable because they do the work for the user).
- Information: eBooks, “cheat sheets,” or webinars (easiest to make, hardest to make “unique”).
- Service: Free 15-minute audit or a “Look-over-your-shoulder” call.
- Physical: Free-plus-shipping book or a physical sample.
- Where does the SLO plug in?
This is the most misunderstood part.
The SLO (Self-Liquidating Offer) is a low-priced product (usually $7 to $97) that is pitched immediately after someone grabs the free Lead Magnet.
The Funnel Flow:
- Ad/Traffic: You spend money to get clicks.
- Lead Magnet (Free): They give you their email to get the “Salted Pretzel.”
- The SLO (Thank You Page): Instead of a standard “Check your email,” you show a video (VSL) saying: “Since you’re interested in X, you’ll love Y. It’s normally $200, but it’s $27 right now.”
- The Goal: The money from the $27 sales pays for the ads from Step 1.
Hormozi’s Rule: If you spend $100 on ads and get 50 leads + $100 in SLO sales, your Lead Cost is $0. You can now scale to infinity because your leads are “free.”
- Matching Magnets to Offers
To maximize conversion, the “problem” the magnet solves must perfectly “pre-frame” the offer:
Magnet: A calculator that shows how much money you’re losing on taxes.
- SLO: A $47 “Tax-Saving Quick-Start Toolkit.”
- Core Offer: $5,000/year Accounting Services.
Magnet: A free workout video for busy moms.
- SLO: A $19 recipe book for 15-minute healthy meals.
- Core Offer: $200/month 1-on-1 Online Coaching.
You’ve got the logic down: the 3 Types are the strategy (why it works), and the 4 Deliveries are the medium (how they get it).
Think of it like a restaurant: the Type is the flavor profile (Salty, Sweet, Savory) designed to make you hungry for more, while the Delivery is how it’s served (Appetizer, Drink, Buffet, Takeout).
Here is how they intersect to create a high-converting “Salted Pretzel”:
The Matrix: Strategy vs. Medium
| Strategy (The 3 Types) | Software Delivery | Information Delivery | Service Delivery | Physical Delivery |
|---|---|---|---|---|
| 1. Reveal the Problem | A “Profit Leak” Calculator. | A “Red Flag” PDF Checklist. | A Free 5-Min Security Audit. | A “Water Hardness” Testing Kit. |
| 2. Give a Sample | 7-Day Trial of a CRM. | A Free Masterclass Lesson. | A 15-Min Mini-Consult. | A Trial-Sized Supplement. |
| 3. Step 1 of N | A template pre-loaded in an app. | A “How to Set Up Your LLC” Guide. | A “Done-for-you” Website Header. | A “Starter Tool” (e.g., a free brush for a paint kit). |
Critical Nuance: The “Valued-Based” Hierarchy
Hormozi points out that not all deliveries are equal in the eyes of the customer.
Usually, the value is perceived in this order:
- Software/Tools (Highest Value): It does the work for them. People will pay for tools, so getting them for free feels like a “steal.”
- Services: You are giving them your (or your team’s) labor. Very high trust-builder.
- Physical Goods: There is a “real” cost to shipping a box. It feels more substantial than a link.
- Information (Lowest Value): Because information is everywhere, your “Info” magnet must be extremely specific and immediately actionable to avoid being ignored.
Where most people fail:
They create an Information magnet that is too broad (e.g., “How to be Happy”) and deliver it as a 50-page eBook. No one reads it.
The Winner: A Software magnet (e.g., “The Happiness Scorecard Spreadsheet”) that Reveals a Problem (e.g., “Your Social Connection Score is dangerously low”).
This creates a massive “itch” that only your Core Offer can scratch.
The Tier of Service: this fits at DIY / DWY / DFY in the value ladder.
flowchart LR
    %% --- Styles ---
    classDef free fill:#E8F5E9,stroke:#2E7D32,stroke-width:2px,color:#1B5E20;
    classDef low fill:#FFF9C4,stroke:#FBC02D,stroke-width:2px,color:#FBC02D;
    classDef mid fill:#FFE0B2,stroke:#F57C00,stroke-width:2px,color:#F57C00;
    classDef high fill:#FFCDD2,stroke:#C62828,stroke-width:2px,color:#C62828;
    classDef bridge fill:#E3F2FD,stroke:#1565C0,stroke-width:3px,color:#0D47A1;

    %% --- Nodes ---
    L0("Free Content
($0)"):::free
    L1("AuditMagnet 🛡️
(Free Web Audit )"):::free
    L11(" Blog/Youtube"):::free
    L12(" ebooks"):::free
    L2("DIY
(Optimization Guides) $"):::low
    L3("Done With You
(Consulting) $$"):::mid
    L4("Done For You
(Full Service) $$$"):::high
    L44("TBC
New Service"):::bridge

    %% --- Connections ---
    L0 --> L1
    L0 --> L2
    L0 --> L11
    L0 --> L12
    L2 --> L3
    L3 --> L4
    L3 --> L44
The Tier of Service: because The value ladder is a thing
Example: DIY (1b - leverages on actual tech stack Ive put together - PaaS x (WP/Ghost or SSG+CMS))
flowchart LR
    %% --- Styles ---
    classDef free fill:#E8F5E9,stroke:#2E7D32,stroke-width:2px,color:#1B5E20;
    classDef low fill:#FFF9C4,stroke:#FBC02D,stroke-width:2px,color:#FBC02D;
    classDef mid fill:#FFE0B2,stroke:#F57C00,stroke-width:2px,color:#F57C00;
    classDef high fill:#FFCDD2,stroke:#C62828,stroke-width:2px,color:#C62828;

    %% --- Nodes ---
    L0("Free Content
(Blog/YT/Docs $0)"):::free
    L1("AuditMagnet 🛡️
(Free Web Audit $0)"):::free
    L2("DIY
(Optimization Guides) $"):::low
    L3("Done With You
(Consulting) $$"):::mid
    L4("Done For You
(Full Service) $$$"):::high

    %% --- Connections ---
    L0 --> L1
    L1 --> L2
    L2 --> L3
    L3 --> L4
GTM Strategy: The Master Plan important if you bootstrap!
A GTM strategy is a cross-functional roadmap that answers the question: “How will we bring this new product to market successfully?”
It aligns all key business functions, including:
- Product: What are we selling? What problem does it solve?
- Pricing: How much will we charge?
- Distribution/Sales: How will we get the product into the hands of customers? (e.g., direct sales team, e-commerce, third-party distributors).
- Marketing: How will we generate awareness and demand?
- Customer Success/Support: How will we onboard and support customers after they buy?
| Aspect | Go-to-Market (GTM) Strategy | Marketing Strategy |
|---|---|---|
| Purpose | To successfully launch a specific product or enter a new market. | To achieve overall business and brand goals over the long term. |
| Scope | Broader and more tactical. It encompasses sales, marketing, pricing, distribution, and more. | A focused component of the GTM strategy. It is concerned with brand awareness, communication, and demand generation. |
| Time Horizon | Short-term and event-driven. It’s typically a “sprint” for a specific launch. | Long-term and ongoing. It is continuously evolving to support the brand. |
| Responsibility | Owned by the executive team, often led by a Product Marketing Manager (PMM) or a cross-functional GTM team. | Owned by the marketing team. |
A strong GTM strategy ensures that your product is ready for the market
While your marketing strategy ensures that the market is ready for your product.
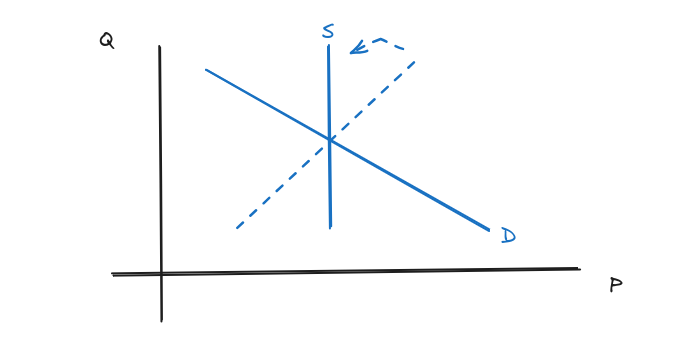
The Strategic Game Board
Know your sector/game!
This table identifies the fundamental nature of the business model and its primary bottleneck.
| Feature | Guest Photo WebApp | Educational Model | Fractional Consultant |
|---|---|---|---|
| Business Archetype | B2C Indie Hacker (SaaS-Lite) | Info-Product / Course | B2B Specialist (Path C) |
| Primary Lever | Volume () | Volume () | Price () |
| Strategic Tag | [GROWTH BET] | [GROWTH BET] | [OPERATIONAL DISCIPLINE] |
| Customer Intent | Emotional (Memories) | Aspirational (Success) | Rational (ROI/Profit) |
| Execution Risk | Technical/Server Downtime | Content Obsolescence | Personal Burnout/Time |
| Main Constraint | Demand (Marketing) | Demand (Attention) | Supply (Expert Hours) |
| Macro Winner | Low-cost luxury (Recession) | Upskilling (Recession) | Interest Rate Neutral |
The Business Model Canvas, which is a globally recognized framework that helps visualize how Attraction (Channels/Customer Relationships), Delivery (Key Activities/Resources), and Conversion (Revenue Streams) work together to create a profitable business.
Splitting a business into Attraction, Conversion, and Delivery is an excellent way to view the “Engine” of a company.
While the profit formula: ($P \times V \times GM \times OM \times IF \times T$)
$CAGR = \left( \frac{V_f}{V_i} \right)^{\frac{1}{t}} - 1$.
$$ NaOH(s) \xrightarrow{H_2O} Na^+(aq) + OH^-(aq) + \text{heat} $$
$$ P \times V \times GM \times OM \times IF \times T $$
tells you what is happening to the money.
This three-part framework tells you how the work is getting done:
graph LR
    %% Inputs (The Business Activities)
    subgraph Attraction [Attraction]
        Mkt[Marketing & Brand]
        AI_Strat[AI Growth Strategy]
    end

    subgraph Conversion [Conversion]
        Sales[Sales Alignment]
        AM[Account Management]
    end

    subgraph Delivery [Delivery]
        EVP[Employee Value Prop]
        Dev[AI Delivery Tools]
    end

    %% The Engine Connections
    Attraction --> |"Leads/Pipeline"| Conversion

    Conversion --> |"Yields"| P[Price]
    Conversion --> |"Yields"| Q[Quantity/Volume]

    P --> M1{x}
    Q --> M1

    M1 -- "Revenue" --> GM_Calc[Gross Margin Calculation]

    %% Delivery directly impacts the cost of goods
    Delivery -.-> |"Efficiency/Utilization"| GM_Calc

    GM_Calc -- "Gross Profit" --> OM[Operating Margin %]
    OM -- "Operating Income" --> IB[Interest/Borrowing Cost]
    IB -- "EBT" --> TB[Tax Burden %]
    TB -- "Net Profit" --> NP[Bottom Line]

    %% Styling
    style Attraction fill:#f9f,stroke:#333
    style Conversion fill:#bbf,stroke:#333
    style Delivery fill:#dfd,stroke:#333
    style NP fill:#f96,stroke:#333,stroke-width:4px
Operating Margin ($OM$) acts as a “bridge” between today’s work and tomorrow’s growth.
If we use that logic, we can define the relationship between the two margins as Execution vs. Evolution.
- Gross Margin: The “Today” (Execution)
If OM is the bridge to tomorrow, GM is the engine running today. It measures the fundamental “profitability of the task.”
If you are an IT company, answers the question: “Can we deliver this AI project for less than we charged the client?”
- The “Now” Indicator: It tells you if your current workforce is skilled enough, if your tools are efficient, and if your pricing is correct.
- The Limit: sets the “ceiling” for your business. No matter how much you cut costs in (like firing the HR team), your net profit can never be higher than your Gross Margin.
- The 2026 Strategy: By focusing on “AI delivery tools,” the company is trying to widen the . If they can do the same work in 50 hours that used to take 100, the expands.
- Operating Margin: The “Bridge” (Evolution)
The OM is where the company decides how much of “today’s profit” to sacrifice for “tomorrow’s growth.”
- The Reinvestment Zone: This is where you pay for the Attraction and Conversion we discussed. You take the money made in Delivery () and spend it on Sales, Marketing, and R&D.
- The Efficiency Test: also tests if the company is becoming a “bloated bureaucracy.” If is high but is low, the company is great at the “work” but terrible at “running the business.”
- The 2026 Strategy: The company is betting that by investing in the Employee Value Proposition (higher pay/training), they are building a stronger bridge. They are spending more in today to ensure they can capture that 7.5% revenue growth tomorrow.
- Comparing the Two (The “IT” View)
| Feature | Gross Margin | Operating Margin |
|---|---|---|
| Focus | Delivery & Production | Strategy & Infrastructure |
| Primary Cost | Billable Labor (Developers) | Non-billable Labor (Sales, HR, CEO) |
Delivery is the “production line.”
In an IT company, this is the act of turning human hours and cloud compute into a finished product for a client.
- The Lever: This is driven by COGS (Cost of Goods Sold).
- Why it’s here: Because the salaries of the developers and project managers are variable—if you have no clients, you (theoretically) don’t need these specific delivery hours.
- The “Health” Metric: If your is 40%, it means for every $100 the client pays, it cost you $60 in “Delivery” (salaries and software) to make it.
- Attraction & Conversion = The Level (Indirect Costs / OpEx)
Attraction and Conversion are the “growth machinery.”
They sit in the OM because they are Operating Expenses (OpEx).
- Attraction (Marketing): This is your S in SG&A (Selling, General & Administrative). You spend this money to create a brand so that people want to work with you.
- Conversion (Sales/Account Management): This is also in SG&A. These people take the leads from Attraction and turn them into contracts ( and ).
- Why it’s here: These costs are usually fixed or semi-fixed. You pay your Head of Marketing and your Sales VP whether they close 1 deal or 10 deals this month.
With a specific company goals, here is how the “Spending” vs. “Earning” works:
| Stage | Activity | Margin Level | Strategic Goal |
|---|---|---|---|
| Attraction | AI Marketing / Branding | OpEx | Build the “AI Expert” reputation so you can charge a higher Price. |
| Conversion | Sales & Account Mgmt | OpEx | Increase the Volume of AI-specific contracts. |
| Delivery | Developers + AI Tools | COGS | Use AI tools to increase efficiency, keeping the Gross Margin high even after giving Pay Raises. |
- GM is the cost of doing the work. (Delivery)
- OM is the cost of getting the work and managing the growth. (Attraction & Conversion)
The Unit Economics
The “Full Stack” Multiplicative Formula that works for all the games.
The formula for Net Profit (NP) is: NP=(V×P)×GM×OE×IB×TB
If we define: see what are the profit levers
- V=Volume (Units Sold)
- P=Price (Average Selling Price)
- GM=Gross Margin Ratio(RevenueGross Profit)
- OE=Operating Efficiency Ratio(Gross ProfitEBITDA)
- IB=Interest Burden(EBITPre-tax Income)
- TB=Tax Burden(Pre-tax IncomeNet Income)
Using the formula you get a map the “Survival Rate” of every dollar earned.
To get the most granular view, we start with the “Top Line” (Units and Price)
Then, apply each “Survival Rate” (the margins and burdens) until we reach the “Bottom Line.”
Case Study: The QR Guest Photo App
Model: High Volume, Automated Execution.
| Variable | Tag | Value | Logic / The “Drain” |
|---|---|---|---|
| Price | [BET] | $49 | One-time “Event Pass.” Low requires high to cover ads. |
| Volume | [BET] | High | Scaling via Pinterest/TikTok virality and “Event Flywheels.” |
| Gross Margin | [EXECUTION] | 95% | COGS: S3 Storage/API. Almost zero production cost. |
| Op. Efficiency | [DISCIPLINE] | 50% | OpEx: 50% of revenue “leaks” to Customer Acquisition (Ads). |
| Solvency (Cash Flow) | [STRUCTURE] | Instant | Payment is upfront. Zero “Payback Period” delay. |
| Net Profit | BOTTOM LINE | ~$23/unit | High-efficiency digital delivery. |
- The “Levers” Comparison: You vs. The Giants
How a 1-person model compares to global industry leaders?
| Component | Walmart | Microsoft | Indie Hacker / Fractional |
|---|---|---|---|
| Main Lever | Volume | Price & Scale | Efficiency |
| Biggest Cost | Inventory (COGS) | R&D & Salaries (OpEx) | Marketing (B2C) or Time (B2B) |
| CapEx Role | Massive (Physical Assets) | High (Data Centers) | Zero (Intellectual Property) |
| Inventory Logic | High Turnover (Flow) | Zero Marginal Cost | High Unit Value (Filter) |
| Strategic Tag | [EXECUTION] | [BET] | [DISCIPLINE] |
- The COO’s Diagnostic Checklist
When a specific part of the formula is “broken,” use these tags to identify the fix.
- If Net Profit is low despite high sales: You have a [DISCIPLINE] problem (OpEx). Your ads are too expensive or your software bloat is too high.
- If customers are complaining about the product: You have an [EXECUTION] problem (GM). Your “factory” (code or service quality) is failing.
- If the market doesn’t know you exist: You have a [BET] problem (OpEx). You aren’t spending enough on the “Awareness Lever.”
- If you are “profitable” but have $0 in the bank: You have a [STRUCTURE] problem (Solvency). You are paying suppliers faster than customers pay you.
Whenever you analyze a new business opportunity, drop it into the “Empty Column” of Table 1.
If it has a Supply Constraint, focus on raising your Price.
If it has a Demand Constraint, focus on increasing your Volume
This contrast when the cases where you built a SaaS, which has a potentially infinite supply.
In this case, you are demand constrain and thats why you wont go far without proper OpEx bet:
This adds the “Emotional and Tactical” layer to the math.
It helps you identify where the “friction” will be in your daily life depending on which path you take.
Here is the Opportunity & Pain Point Matrix for your reference.
The Reality Check: Focus vs. Friction for each of the games
| Model | Biggest Focus (Daily Action) | Biggest Opportunity (The “Win”) | Biggest Pain Point (The “Squeeze”) |
|---|---|---|---|
| Guest Photo WebApp | Conversion Rate Optimization (CRO). Making the landing page “buy-worthy” for a 5-second visitor. | Virality. Every event guest is a “Free Lead” for the next event. Zero-cost growth. | Platform Dependency. Changes in Meta/TikTok ad costs or Google’s SEO algorithm can kill margins overnight. |
| Educational Model | Content Authority. Building a personal brand that people trust for their future. | “The Echo Effect.” One recorded lesson can be sold 10,000 times with zero extra effort. | Support Debt. As grows, the “How do I do this?” emails grow, threatening your Operating Efficiency (). |
| Fractional Consultant | High-Level Strategy. Moving from “Pulling Levers” to “Directing the Machine.” | Arbitrage of Time. Getting paid for the outcome of 2 hours that took everyone else 16 hours. | Client Acquisition. High-ticket sales require trust and networking. If you lose one client, you lose 20–30% of revenue. |
| P&G (FMCG Giant) | Market Share. Defending the “Shelf Space” at Walmart and Target. | Economies of Scale. Squeezing a fraction of a cent out of a billion bottles of soap. | Commoditization. Generic “Store Brands” stealing by undercutting the [BET] (Brand). |
The 4-Week “Launchpad” Checklist
Week 1: The Operational Audit (Discipline)
- Keep the “Alpha” Job: Identify which of your two current jobs has the lowest “Meeting-to-Output” ratio. This is your “Corporate VC” funding your life.
- Time-Boxing: Since you finish your work in 5 hours (half of your 10-hour efficiency), explicitly block the other 5 hours (e.g., 1 PM – 6 PM) for WebApp Execution.
- Setup the Legal/Tax Structure: Use a small portion of your $100k to set up a clean legal entity to separate your “Salary” from your “Startup Assets.”
Week 2: The Infrastructure Build (Execution)
- The MVP Tech Stack: Since you are an analyst, don’t over-engineer. Use low-code or specialized APIs for the QR generation and S3 for the photo storage.
- Unit Economic Stress Test: Plug your actual hosting and API costs into your formula. Ensure your Gross Margin () is at least 90%.
- Packaging the Upsell: Hard-code the “Permanent Storage” upsell from Day 1. This is your highest-margin lever.
Week 3: The Growth Bet (Marketing)
- Asset Creation: Create 5–10 “Aesthetic” videos showing how the QR code looks on a wedding table. (Pinterest and TikTok are your high- levers).
- The Ad Budget: Allocate ~$2,000 (around 1/2% of your net assets) for a “Learning Phase” on Meta/TikTok ads.
- Goal: Find your Initial CAC (Customer Acquisition Cost). If you spend $100 and get 2 customers at $49 each, you are at break-even.
Week 4: The “Solvency” Check & Launch
- Launch to a Small Cohort: Post in wedding forums or local Facebook groups.
- The Feedback Loop: Use your analyst skills to track the Funnel Drop-off. Where are people leaving the site? (Landing Page -> Upload -> Payment).
- The Pivot Point: If the Volume is low, adjust the Price or the Growth Bet (Ad Creative).
graph LR
    %% Unit Economics Engine
    subgraph Engine [Unit Economics Engine]
        P[Price] --> M1{x}
        Q[Quantity/Volume] --> M1
        M1 -- "Revenue" --> GM[Gross Margin %]
        GM -- "Gross Profit" --> OM[Operating Margin %]
        OM -- "Operating Income" --> IB[Interest/Borrowing Cost]
        IB -- "EBT" --> TB[Tax Burden %]
        TB -- "Net Profit" --> A
    end

    %% Main Flow
    A[Business Net Profit
Focus] -- "5x Life Expenses" --> B{Allocation Hub}

    %% Distribution Branches
    B -- "x2.5 (50%)" --> C["Keep & Grow Wealth
(Diversify)"]
    B -- "x1.5 (30%)" --> D[Tax]
    B -- "x1.0 (20%)" --> E[Lifestyle]

    %% Styling
    style Engine fill:#f0f4f8,stroke:#0056b3,stroke-width:2px
    style A fill:#f9f,stroke:#333,stroke-width:2px
    style B fill:#fff,stroke:#333,stroke-dasharray: 5 5
    style C fill:#d4edda,stroke:#28a745,stroke-width:2px
    style D fill:#f8d7da,stroke:#dc3545,stroke-width:1px
    style E fill:#fff3cd,stroke:#ffc107,stroke-width:1px
Expand it here.
Building a HOW with Sense
A BRD is what works best for me now to ship fast as described here.
Take time and define properly the why and what: including what’s out of scope, specially if you are just one person
It’s all about doing spec-driven development with AI agents and ship your vision.
Call it SRS: software requirement speficication, whatever.
Just provide clear instructions of your vision and be ready to deploy to your server.
graph LR
    %% 1. The Split
    Start[Define] -->|Why| B[BRD]
    Start -->|How| C[FRD]
    Start -->|What| D[PRD]

    %% 2. The Join
    B & C & D --> E(Clarify)

    %% 3. The Linear Flow
    E --> F[Development Plan]
    F --> G[Finished PoC]

    %% Styling
    style G fill:#f96,stroke:#333,stroke-width:4px
    style Start fill:#bbf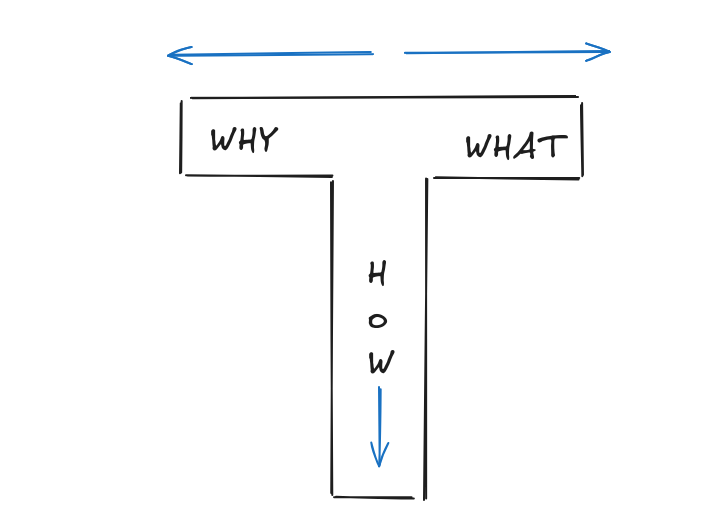
style F fill:#e1f5fe- BRD (Business Requirements): Answers “WHY build this?” (The Vision & Goals).
- PRD (Product Requirements): Answers “WHAT are we building?” (The Features & Roadmap).
- FRD (Functional Requirements): Answers “HOW does it work?” (The Technical Logic & CRUDs).
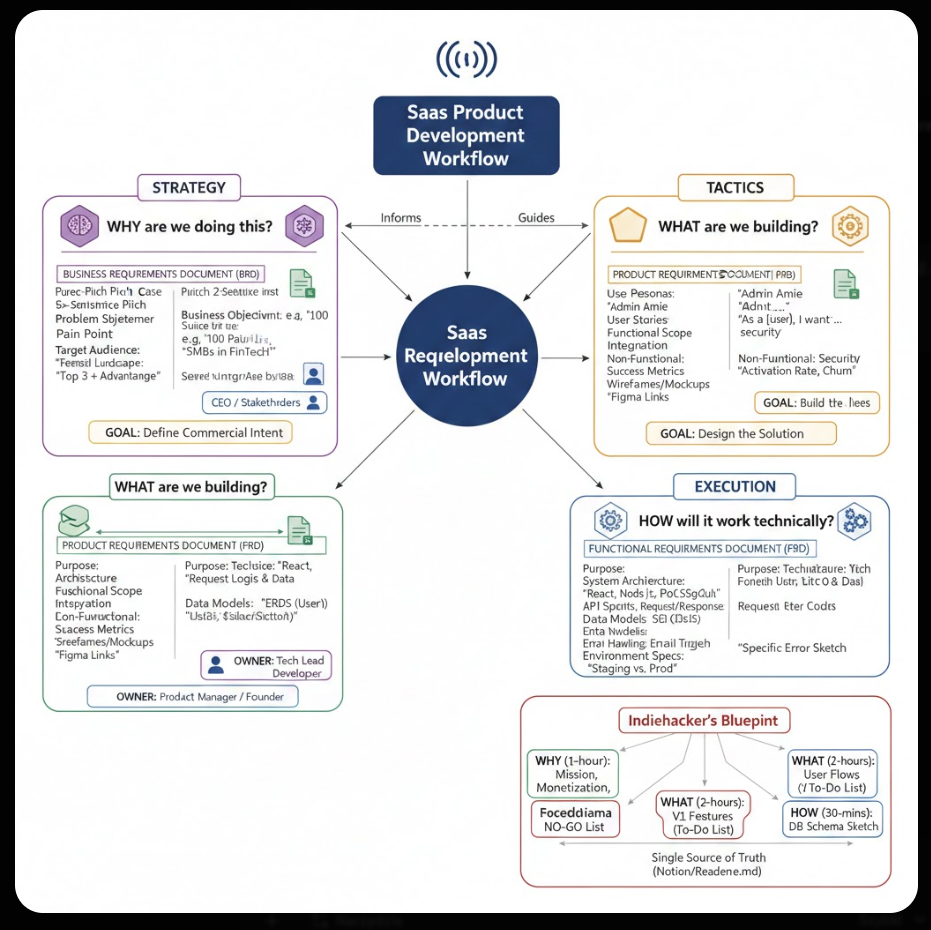
See how if you are an indie-dev doing boostrap, you can simplify further the flow.
The WHY can be your main concern, that you can refine via a z-brd.md
The ,How’ can be taken care of: yep, antigravity does the trick
And if you’ve been clear enough on the vision, you will get it done:

Together with a nice tech stack: it always helps to know what to ask for
And the human psyc considered to bundle everything.
The tech stack:
| Requirement | Specification | Clarification / Decision |
|---|---|---|
| Frontend Framework | ||
| Styling/UI Library | ||
| Backend/Database | ||
| Authentication | ||
| Others | Web Analytics / ads / Cal / Formbricks / ESP |
MoSCoW (Must have, Should have, Could have, Won’t have aka Out of scope )
For me, working with antigravity and such tech stack below does the trick.
Also for reference, I like to add a clear: BRD, tech stack, dev phases, sales, more sales and landing psyc
Vibe Coding | Setup 📌
Go to whatever LLM you are using and ask: do you think that these requirements are clear enough?
I need Landing Page based with a cool and modern UI.

Create also a makefile with the following commands:

* `make help` - Show available commands
* `make install` - Prepare the dependencies for local development
* `make dev` - Run development server

Create the `z-development-plan.md` with independent and testable phases that can be completed sequentially.

When it is completed, create a `z-walkthrough.md` with the steps to deploy the application and what each part of the tech stack does on a high level to bring the features to life.

The full copy od the landing, has to be goberned by a single `site.md` file.

Consider adding a Terms of Service / **terms and conditions and privacy policy** to the website, which will be governed by two separated markdown files.

Add also a faq section, that instead of been controlled via a json, lets have it controlled as per the frontmatter and content of separated markdown files inside the folder `faq`.
Go to [AntiGravity IDE] and ask if the brd.md refined already with Gemini is clear enough.
If it is clear define the z-development-plan.md and proceed with the development phases.
As you will need to iterate across features, do it like a pro with change-requests:
#sudo apt install gh
gh auth login
#gh repo create make-xyz --private --source=. --remote=origin --push

git init && git add . && git commit -m "Initial commit: simple landing website" && gh repo create make-xyz --private --source=. --remote=origin --push
###du -sh .
#docker stop $(docker ps -a -q) #stop all
#docker system df
Technical Stack and Design Requirements
To develop a modern, secure, and scalable landing page with modular astro components for getting leads via formbricks.
| Requirement | Specification | Clarification / Decision |
|---|---|---|
| Frontend Framework | React (Astro/Vite) | Chosen for low latency and modern “Island” architecture. |
| Styling/UI Library | Tailwind CSS v4 + Framer Motion | Custom “Deep Night” glassmorphism theme for a premium look. |
| Deployment | Firebase hostin | Serverless. |
Yep, there is something cooking up around an agency that needed some help:
whois leadarchitect.org| grep -i -E "(creation|created|registered)"
#nslookup leadarchitect.org
Any Business Who What How
This makes perfect sense and completes the “holy trinity” of the Hormozi framework.
This connects the Market (Who), the Offer (What), and the Leads (How).
Your synthesis of the “Hot Dog” analogy and the “Niche Slap” is critical because it highlights a counter-intuitive truth: Constraint creates profit.
Most people fear that narrowing their focus will limit their income, but as you correctly pointed out, it actually increases the Value Per Customer.
- The Value-Specificity Correlation
You hit the nail on the head with the Time Management example. This is the Expertise Premium.
- When you are a generalist, you are a commodity (priced by the market).
- When you are a specialist, you are a monopoly (priced by you).
By narrowing the niche, you aren’t just changing the name; you are changing the perceived certainty that the product will work for that specific person.
In Hormozi’s Value Equation, “Perceived Likelihood of Achievement” goes up when the solution feels tailor-made.
- The “Four Indicators” as a Filter
Your summary of the indicators (Pain, Purchasing Power, Targeting, Growth) is the ultimate “Go/No-Go” checklist.
- Many entrepreneurs find a niche with Massive Pain (e.g., struggling artists) but zero Purchasing Power.
- Others find Purchasing Power but no Targeting (e.g., “rich people” is not a targetable niche; “Orthodontists in Florida” is).
A business only scales if it hits all four!
- The “Puddle to Ocean” Evolution
This is a sophisticated takeaway from $100M Leads. It prevents the “Generalist Trap.”
- The Puddle: You become the “Facebook Ad Guy for Local Pizza Shops.” (Easy to dominate).
- The Pond: You become the “Ad Guy for Local Restaurants.”
- The Lake: You become the “Marketing Consultant for Franchise Food Brands.”
- The Ocean: You are “Alex Hormozi,” advising all businesses.
If you skip the Puddle and go straight to the Ocean, the giants (who have more ad spend) will simply outbid you for attention.
This “Niche” concept plugs into what we discussed earlier:
- Lead Magnet: Instead of a generic “How to get leads” PDF, a niched magnet would be “How to get 5 new patients for your Dental Practice this week.” (Higher conversion).
- Attraction Offer: Instead of a “Business Audit,” you offer a “Patient Flow Audit.”
- SLO: The niche allows you to create a specific tool (Software Delivery) that solves a niche problem, making the self-liquidating offer feel like a “must-have.”
I have added the Niche & Market layer to our map to show how it sits at the foundation of everything else.
mindmap
  root((Hormozi Business Engine))
    (Niche: The Foundation)
        [The 4 Indicators]
            Massive Pain
            Purchasing Power
            Easy to Target
            Growing Market
        [Strategic Growth]
            Puddle > Pond > Lake > Ocean
            The Niche Slap :: Commitment
            Specific = Premium Price
    (Tactics: $100M Leads)
        [The 3 Strategic Types]
            Reveal the Problem
            The Sample
            Step 1 of N
        [The 7-Step Process]
            Problem > Solution > Delivery > Name
    (Strategy: $100M Money Models)
        [The 4 Offer Types]
            Attraction :: Lead Magnets
            Core Offer :: The Niche Solution
            Upsell / Continuity
        [Economic Goals]
            CFA :: Client Financed Acquisition
            The Salted Pretzel Cycle
Expand it here
Understand that who you sell to (Niche) dictates what you sell (Offer) and how you find them (Leads).
Conclusions
Now that you have protected your mind and time from your and other’s non discounted new ideas
Hopefully, that helps you avoid going for ideas like:
- A SaaS model to aim for V and low P, for a non well defined avatar, when you dont want OpEx and think it will all be GM - Like Webifyer and all the web/CMS I tried here
- To provide custom D&A services to the wrong avatar (that also have wrong avatar and pays you less than your opportunity cost) - Been there, done that, here
- To expect people to consume your DIY/Infoproduct when you dont do ads, neither took the time to built a community. - Hopefully, I havent done that because I made the 1tonebooks here just to consolidate my knowledge and help for free.
- WIP Operational Discipline: high-ticket custom services alternative for the ones (to be found) who have great projects
- WIP The growth bet: via the QR photo app + the ads experiment
PS: The price is part of the product/service
All that non sense preassure and expectations of the ideas that are supposed to work, but they wont do from their conception.
It would be great to go to the past with what you know now.
But what you can do is to bring knowledge from the future to the present.
How about: getting things done?
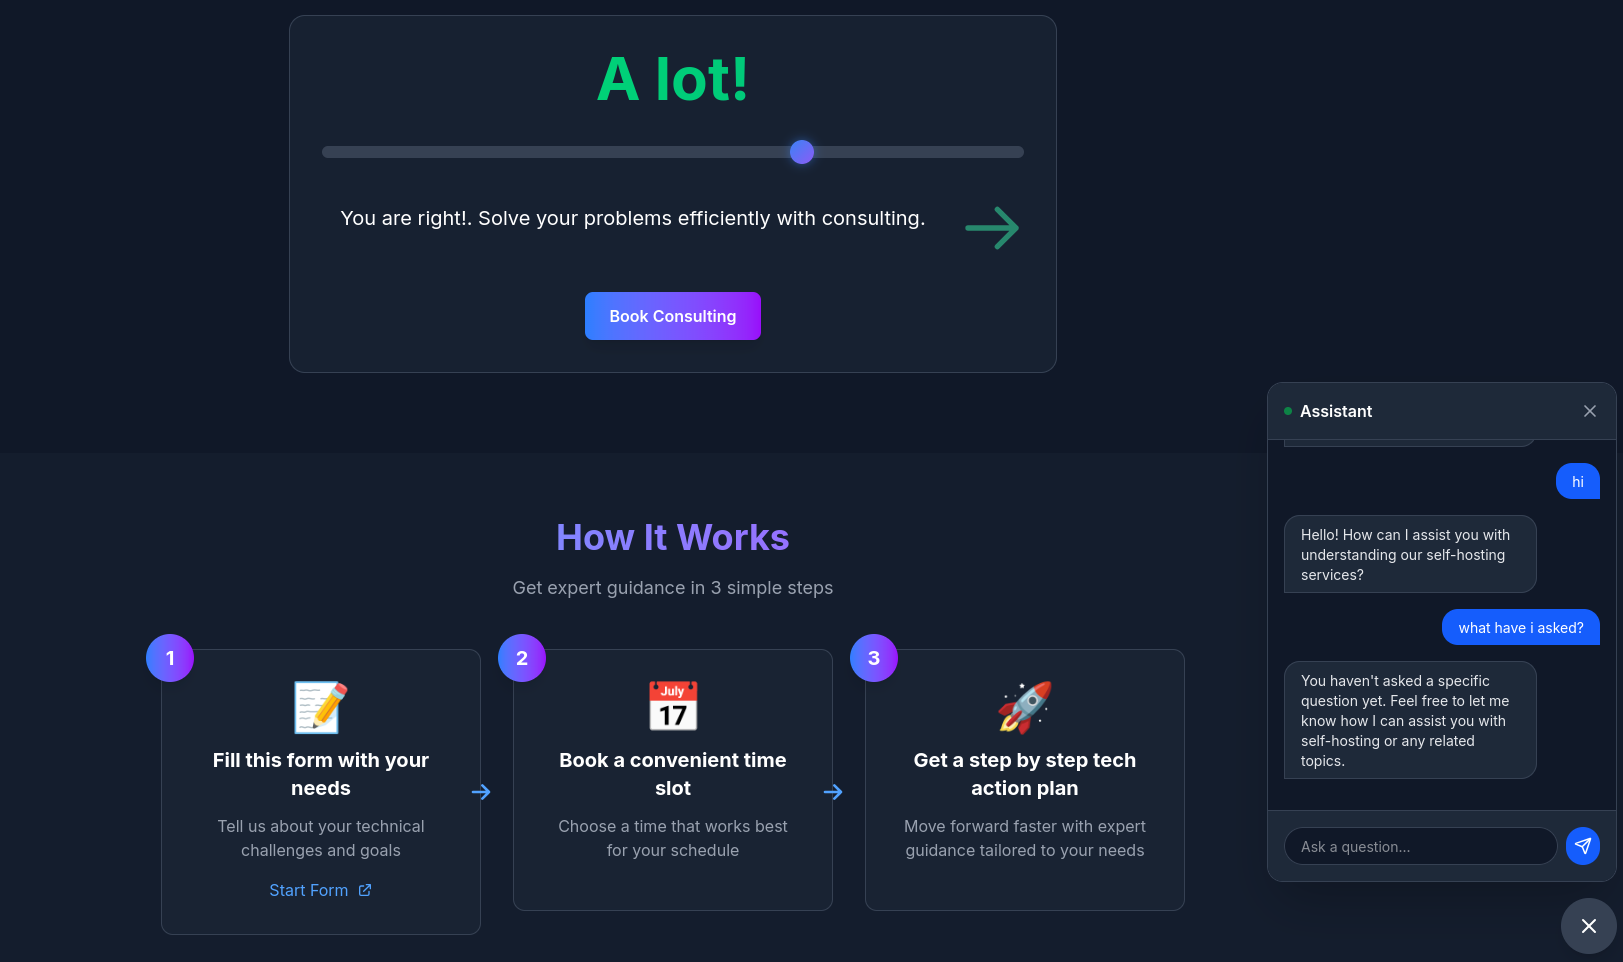 Consulting Services
 Generative BI - For You
FAQ
More about building in public and shipping with AI?