Learning with/from agents
TL;DR
What is learning?
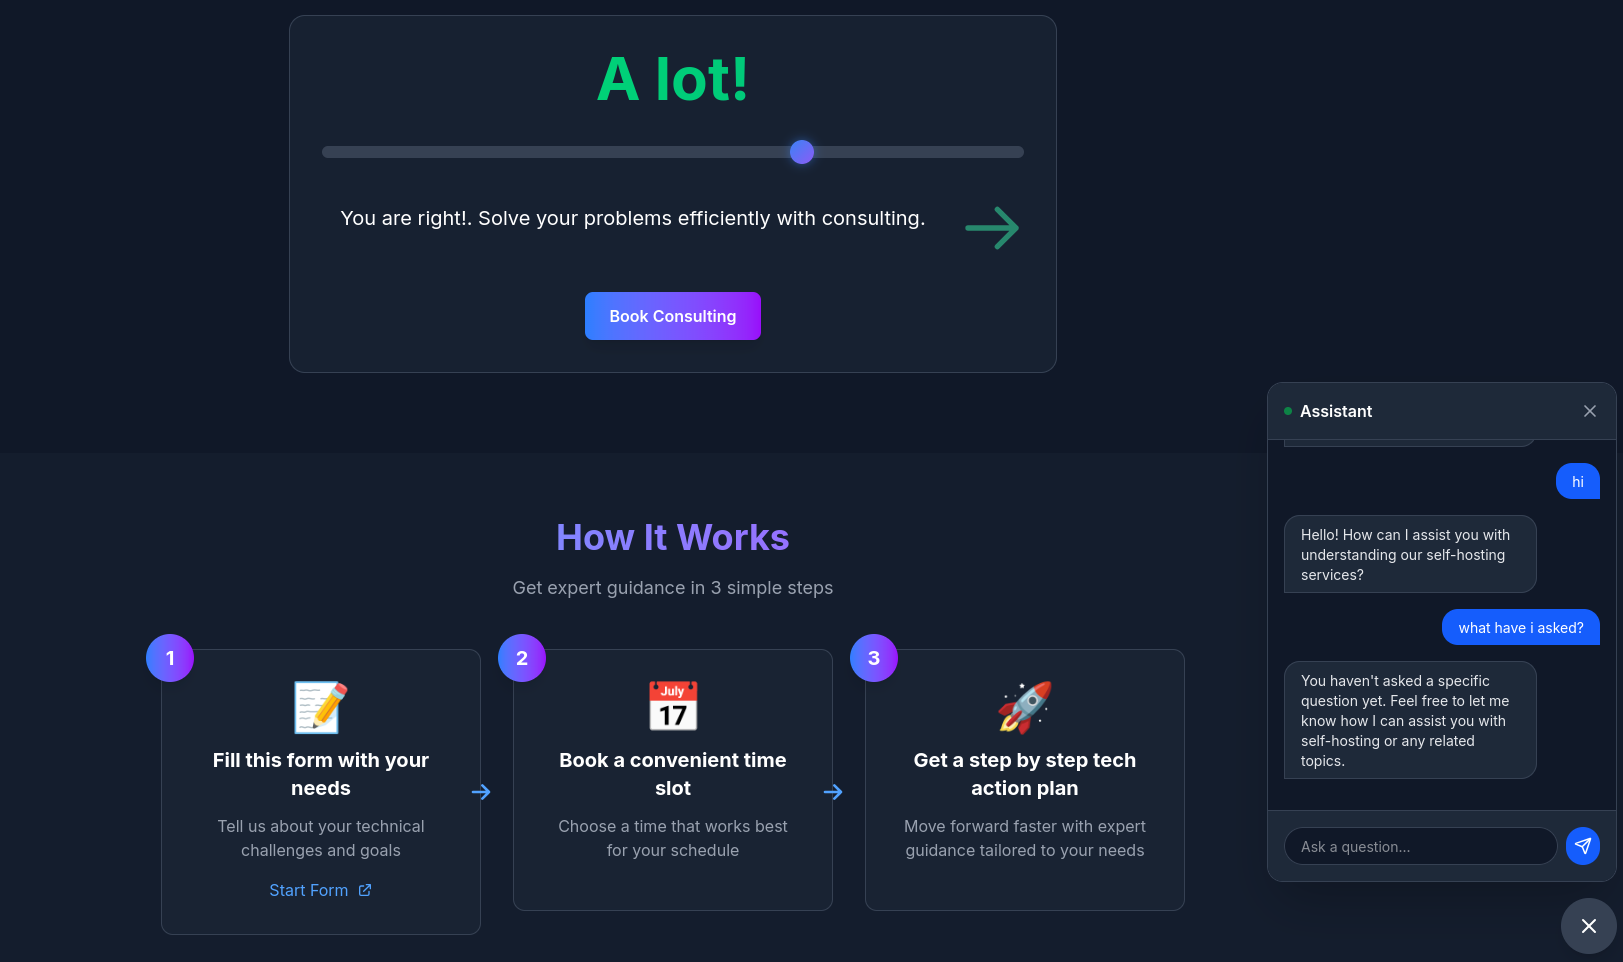
Hows going with your value prop?
Intro
Context windows and context rotting is a thing.
- https://github.com/thedotmack/claude-mem
- https://github.com/simon125
- https://github.com/snarktank/ralph
- https://github.com/trailofbits/claude-code-devcontainer
MIT | Ralph is an autonomous AI agent loop that runs repeatedly until all PRD items are complete.
PRDs? where have I heard about thos?
Innovate, imitate or… stay incompetent?
Are you one of those that choses stay incompotent, because learning and doing is just getting easier?
Like, I could have skipped doing all those astro clones and directly vibe coded with this cool UI prompt
But…have you ever tried?
How much deflation is enough?
Conclusions
Not been eager to learn today feels like:

At least, you got the time to know yourself by asking questions, like these of ikigai?
flowchart LR
    %% Styles
    classDef state fill:#E3F2FD,stroke:#1565C0,stroke-width:2px,color:#0D47A1;
    classDef start fill:#43A047,stroke:#1B5E20,stroke-width:2px,color:white;

    %% Nodes
    Start((Start)):::start --> More
    More(Doing MORE):::state
    Better(Doing BETTER):::state
    Newer(Doing NEWER):::state

    %% Internal Feedback Loops (The Grind)
    More -- "Scale Up" --> More
    Better -- "Refine" --> Better
    Newer -- "Test" --> Newer

    %% The Progression Journey
    More -- "Capacity Hit" --> Better
    Better -- "Optimized" --> Newer

    %% The Upward Spiral
    Newer -- "New Baseline" --> More
Will the future of OSS be affected by agents?
I think its quite evident.
It might be also an opportunity to finance directly features that many wants to be implemented.
The code stays open, people group and place crypto money inside a smartcontract, as long as a dev or agent see that the signal is > the effort, it will get implemented.
When validated by users - payment will flow.
Isnt it similar to what polymarket does already?
Imagine how many projects/features can be completed and be available for anyone…forever.
Attract Convert Deliver
Domain expertise and stickiness of core products/services will be key in the world is coming up.
I have been polishing my service offering UI/X with a CRQ and this nice prompt:
git clone #consulting.
git clone #ebook.
 #diy.
 #www.
jalcocertech-services
How do we measure productivity and value now?
Reality have changed, so should KPIs and…teams
Maybe, innovation teams are coming for faster GTM?
How about forward deploy engineers?
Yea, including if you do BI dashboard
git clone https://github.com/JAlcocerT/PBi
cd Sample...
#curl -fsSL https://claude.ai/install.sh | bash
claude #https://claude.ai/recents
#/terminal-setup
#claude --continue or claude --resume to resume a conversation
/model

- claude --continue / claude -c — resumes your most recent conversation
- claude --resume / claude -r — opens an interactive picker to browse and select past sessions

#From inside an active claude session:
/resume #— opens the session picker to switch to a different conversation
#/init
claude "Analyze the Power BI files (model.bim, report.json, daxqueries.json) and create a jira-123.md file explaining how abcd is implemented." -y
#/btw
The vscode extension is also very cool!
Consider that some are depricating all UIs, as the aim is for agents to use these and UI are just dragging them
Do you feel tech deflation coming?
could you create a unambigous-tasks.md with the step by step guidance on how to create those?
from data modelling if required, to where to drag and drop the elements in the UI as if a 15 year old had to build it
I do.
Will AGI come in the next 36m?
If so, none of this will probably matter :)
Wiki Structure
Audience: VP/CTO, Portfolio Leads, Steerco Reading time: 5–7 minutes for the front page Tone: Outcome‑first, sourced, low jargon
One‑liner: “Sourced answers in ≤3s, proactive alerts in ≤15m, and actionable ‘what to change’ guidance—reducing time‑to‑detect by 50% and time‑to‑explain to ≤30s.” Status: 🟢 Discovery | 🟡 Build | 🔵 Pilot | 🔴 Blocked Owner / Contact: Product Owner, Tech Lead Last updated: {auto-populated}
FAQ (Exec‑friendly)
Can it be wrong? Yes—so every answer shows sources, last refresh, and confidence. Who sees what? Access is scoped to your portfolio; raw rows aren’t exposed across divisions. Will this replace dashboards? No. Dashboards remain the system of record; the agent accelerates discovery and explanation. When do we get automation? After trust is established (Phase 3) and with human approvals.
Problem. Leaders see what is off-track but not why or what to change. Approach. Agent layer that answers portfolio questions with sources (≤3s), pushes anomaly alerts (≤15m), and recommends peer‑proven actions. Outcomes (90 days). Time‑to‑detect ↓50%; time‑to‑explain ≤30s; ≥95% sourced accuracy. Decision needed. Approve Phase 1 pilot.
After your first ten, you should have learnt sth about whats working, whats not with your initial value proposition
Attracting Clients
To attract, you can use tools like https://www.clay.com/
just brings eyes to your landing page.
be aware of the value equation:
and follow the full stack business formula from top line, to net profit of your business idea:
$$ P \times V \times GM \times OM \times IF \times T $$
If you dont like crazy speed, most likely operations most likely wont be for you.
Forget about marketing, SCM, DataOps…
To deliver solid products/services, you better start learning/doing agentic delivery.
Because the speed is coming there as well.
Dont forget about the value equation:
$$ Value = \frac{\text{Dream Outcome} \times \text{Perceived Likelihood of Achievement}}{\text{Time Delay} \times \text{Effort & Sacrifice}} $$
And that in most cases, price is not the problem, is the perceived P > Value!
Converting
Tools that will help you convert:
- Emails + Newsletters
- Lean DRIP email campaigns
Delivering
The moment of truth.
If you are delivering services, you better be excellent at them.
Anything counts, as you know, some people get paid to create ppts.
Im not sure how they will treat deflation driven by tech, because literally I pasted this markdown of a slidev presentation to notebookLLM and got a really nice pptx by pressing a button.
In the end, its all about: the goal, not…the tools
| Step | Phase | Activity |
|---|---|---|
| 1 | Discovery | Understand client needs, goals, challenges, and expectations |
| 2 | Data | Gather and analyze relevant data, perform cleaning and exploration |
| 3 | Hypothesis | Develop initial hypotheses based on client needs and data |
| 4 | Method | Select appropriate analytical methods and tools |
| 5 | Analysis | Perform the analysis, document process and results |
| 6 | Insights | Identify key patterns, trends, and findings |
| 7 | Design | Organize insights into a coherent narrative |
| 8 | Iterate | Share with client, gather feedback, refine |
| 9 | Present | Deliver the final data story with clear visuals |
| 10 | Follow-up | Measure success, determine next steps |
Every KPI should follow the SMART framework: which is different to INVEST
| Criterion | Description | Example |
|---|---|---|
| Specific | Clear and well-defined goals | “Develop a KPI dashboard for sales” vs “improve analysis” |
| Measurable | Quantifiable metrics or observable outcomes | Track user engagement increase, time saved |
| Achievable | Realistic given resources, skills, and time | Challenging but within reach |
| Relevant | Aligned with business objectives | Direct impact on key business areas |
| Time-bound | Specific deadline or timeframe | “Complete by Q2” creates urgency |
You will be building KPI across Categories:
| Category | Focus | Examples |
|---|---|---|
| Financial | Revenue, profitability | Revenue growth, profit margin, ROI |
| Customer | Satisfaction, retention | NPS, churn rate, customer lifetime value |
| Operational | Efficiency, quality | Processing time, error rate, throughput |
| Growth | Expansion, reach | Market share, new customers, lead conversion |
If this sounds strange or sth that you could do arbitrage, thats right.
You can become excepcionally good by bringing knowledge from the future, to today:
FAQ
Back Propagation vs Human Brain
With gradient descent we can do cool stuff.
What in particular?
Like…Figuring out a model to get the best route for karting tracks
Mind the hypothesis!
But…what is gradient descent?
And how do we learn?
Questions
Any business has to go through some questions, same as the ideas.
Wrong execution = nothing happened.
The ultimate business answer is a possitive money signal.
If you are trying to build without such signals because you are not so PRO for people to pay you to just join a waiting list.
At least…be good at asking questions / prepare good forms: DISqualifying ideas/clients is the goal
There are some technical/structural questions, others are business & operational
The idea is to have all expectations in sync!
🟢 What the Wiki replies to PROPERLY Your current documentation is excellent at answering technical and structural questions:
How is it built? (PBIP format, Canvas size, Visual IDs).
What is the logic? (DAX formulas for KPIs).
Where is the data? (MySQL, APIs…).
How do I use it? (Slicers, Sync groups, and Bookmark toggles).
What are the rules? (for filters…).
🟡 What could be BETTER (or is currently unresolved) There are a few “Business & Operational” gaps that the technical summary doesn’t quite hit yet:
The “So What?” Factor: While you define the metrics, the Wiki doesn’t explicitly state the action a user should take if a metric is Red.
Data Latency: You list the sources, but not the refresh schedule. Users will ask if the data is “Live” or “Yesterday’s.”
Exception Edge Cases: You mention “Exception Management” in your definitions, but the Power BI Wiki doesn’t show how those exceptions are reflected in the data (e.g., does an approved exception turn a Red “R” into a Gray “N/A”?).
Historical Context: Does the report keep 2 years of data or only the “Last 6 Months” mentioned in the slicer?
🔵 Should you include the “Requirements Gathering” section? Yes, but with a twist. Don’t just list the questions; list the Answers specifically for this dashboard.
In Confluence, I recommend adding a section called “Project Context & Design Intent” using your requirements framework. Here is how it would look specifically for your Sample-DevSecOps report:
Section: Design Intent (The “Why”) Primary Decision Supported: Identifying which applications are “Wave-ready” and which are failing security guardrails.
Target Audience: CTOs (High-level summary) and App Leads (Table drill-down).
Refresh Requirement: Daily sync at 06:00 AM to support morning stand-ups.
Security: RLS is applied based on the Division field to ensure managers only see their own portfolio.
Refresh Frequency: 4x Daily (06:00, 10:00, 14:00, 18:00 EST)
RLS Status: Active (Filtered by Division)
Data Retention: 24 Months rolling
Point of Contact: [Your Name/Team Alias]
You have successfully bridged the gap between technical implementation (DAX/SQL) and business logic.
Dashboarding Requirements Gathering
When gathering requirements for a dashboard, your goal is to deeply understand what decisions the dashboard must support, who will use it, and what data is available.
Below is a practical, structured approach PLUS a list of must‑ask questions you can use in any requirements workshop.
✅ How to Take Dashboard Requirements (Step-by-Step)
1. Start With the “Why”
Before discussing charts or KPIs, understand the purpose of the dashboard.
Ask:
- What problem are we trying to solve?
- What decisions should this dashboard help you make?
- What actions should users take based on this dashboard?
This ensures the dashboard actually supports business value.
2. Identify the Audience
Different users → different needs.
Clarify:
- Who will use the dashboard (roles, experience level)?
- What are their goals?
- How data‑savvy are they?
- How often will they use it (daily, weekly, monthly)?
This influences layout, complexity, and visualization type.
3. Define Key Metrics & KPIs
Once the purpose is clear, identify what needs to be measured.
Ask:
- What are the primary KPIs?
- Are there supporting metrics required to explain the KPIs?
- What does success look like?
- How should each KPI be calculated? (definitions matter!)
4. Understand the Data
Ensures the metrics are actually feasible.
Ask:
- What data sources are available?
- Who owns the data?
- How clean and reliable is the data?
- What are the data refresh requirements? (real-time, daily, weekly)
- Are there any data quality or data governance constraints?
5. Explore the Desired User Experience (UX)
What users see and interact with.
Ask:
- What are the must‑have visualizations? (tables, charts, maps, trends)
- Do users prefer high‑level KPIs first (executive view) or detail first (analyst view)?
- Should filters be available? (date, regions, teams)
- What devices will be used? (desktop, mobile, wall monitor)
- Should users export data/reports?
6. Identify Security & Access Requirements
Important in most organizations.
Ask:
- Who should have access?
- Are there role‑based visibility differences?
- Should any data be restricted or anonymized?
7. Establish Technical & Operational Requirements
Ask:
- What platform will the dashboard run on? (Power BI, Tableau, etc.)
- How often should the dashboard update?
- Performance expectations? (load time, max data volume)
- Do we need versioning or audit logs?
8. Validate with Examples
Ask the stakeholder:
- Do you have screenshots or examples of dashboards you like?
- What dashboards do you currently use, and what do you like/dislike about them?
This speeds up alignment.
⭐ Must‑Ask Questions (Cheat Sheet)
Business & Purpose
- What business problem should this dashboard solve?
- What decisions will this dashboard help you make?
- Who will use it, and what are their goals?
Metrics & KPIs
- What are the key metrics/KPIs you need to track?
- What are the definitions and formulas for these metrics?
- What time periods matter? (daily, weekly, YTD, custom ranges)
Data & Feasibility
- Where does the data come from?
- How often must it refresh?
- Are there known data quality issues?
- Any data security or privacy constraints?
User Experience & Interaction
- What visualizations do you prefer? (bar, line, tables…)
- What filters or drill-downs are needed?
- Which devices do users work on?
- Do users need to export or share results?
Access & Roles
- Who needs access?
- Should some users see different data?
Delivery & Maintenance
- When is the dashboard needed?
- Who maintains it after delivery?
- How often will requirements change?
Want me to create a requirements checklist, interview script, or a dashboard requirements document template for you?
The right value prop?
Based on the framework from the text and the Hormozi Value Equation, your “failure” wasn’t in the technical delivery—you clearly provided a functional, high-performance product.
Instead, it was a misalignment between your Conviction, your Target Audience, and the Value Perception you created.
Here is the breakdown of your main strategic errors:
- The “Conviction” Gap (Self-Devaluation)
The very first page of the text warns: “If you are not convinced of your own merchandise… consider yourself ready for failure”.
- The Error: By charging 0.1 while earning 100+, you signaled that you didn’t value your own time.
- The Result: If you aren’t “sold” on the idea that your work is worth a premium, you cannot answer the buyer’s internal question: “Why should they pay more for what you offer instead of looking for something cheaper?”.
- Attracting “Price-Sensitive” instead of “Value-Sensitive” Clients
The text explains that when a client objects to price, they are often hiding deeper doubts about whether the product is the right decision.
- The Error: By positioning yourself as a “cooler WordPress competitor” at a lower price, you attracted clients who only care about the $100 cost, not the business outcome.
- The Framework: As the author notes, showing a more expensive product helps a client think in qualitative terms. By staying at the bottom, you never allowed your clients to see the “Scenario Ideal” where your AI-dev skills solve their real problems.
- Mismanaging the Value Equation
$$Value = \frac{\text{Dream Outcome} \times \text{Perceived Likelihood}}{\text{Time Delay} \times \text{Effort & Sacrifice}}$$
- Perceived Likelihood: Because you are a new brand compared to Wix or WordPress, your “Likelihood of Achievement” is naturally lower in a stranger’s mind.
- The Error: You tried to compensate for lower trust by lowering the Price, but you kept the Effort & Sacrifice high for yourself by doing custom work.
- The Fix: To beat Wix, you shouldn’t be cheaper; you should be easier. Wix is “Do It Yourself” (High Effort). You should have sold “Done For You” (Zero Effort) at a premium price to offset the brand risk.
- Conversion vs. Attraction
Your “failure” in conversion was likely caused by not answering the Internal Questions mentioned in the text:
- “Will this company really take care of me and my problems?”.
- At 0.1/year, the answer feels like “No,” because a professional can’t afford to care for that price.
- You weren’t “selling the person,” you were selling the “merchandise”.
- The COO view: Whenever you analyze a new business opportunity…
- If it has a Supply Constraint, focus on raising your Price.
- If it has a Demand Constraint, focus on increasing your Volume.
The Lesson: You used your first 10 clients to learn the tech (automation/AI), which is great. But the framework suggests you missed learning the psychology—that people don’t buy code; they buy the certainty that their problem will go away 👌
Doing the hosting of nextcloud for friends and family its just fine to me because i dont expect any monetary signaling :)
btw, when was the last time you said that you care about others? and the last time you made it for free?