[AI/BI] Plug and Play Data Analytics
Tl;DR
Self-service seems to be a thing.
Let’s enable non tech users to extract insights from databases via direct qna within a UI.
Intro
It all started from trying to talk with pandas dataframes.
And there was some evolution around that initial idea.
This is not a new idea, but a new way to approach it.
And not yet trying to sell it.
About RAGs
RAGs frameworks and vector DBs have been around for few years so far.
From all the ways to do rag, Langchain is still the top 1 framework.

From the typical CSVs:
Going through PDF’s:
And most importantly: LangChain can be connected to our databases
#git clone https://github.com/JAlcocerT/Data-Chat #see for yourself the previous langachain x db chat - tinkering
#git clone --depth 1 --single-branch -b main https://github.com/JAlcocerT/Data-Chat
cd LangChain/ChatWithDB
#cd realestate
#npm run build
That was all based on the beauty of LangChain Community SQL database module.
![]()
So…how about leveling up with a cool setup?
The Setup
We will need:
- A Database to tinker with
- A way to connect the DB (inside a container) to Langchain
- A UI Wrapper to do QnA outside the terminal
- Bonus: AI/BI overview to frame how to get visual insights from the data
These resources will provide context:
graph LR
    A[Question] --> B{LangChain}
    B --> C[Retrieve Relevant Data - SQL Query]
    C --> D[PGSql Database]
    D --> B
    B --> E[LLM Prompt with Data]
    E --> F[LLM OpenAI API]
    F --> G[LLM Response]
    G --> H[User]
Databases
We are going to push sample databases with tables already configured towards a container: specially now that I wrote about selfhost pg
We can create read only users so that LangChain will connect to the DB safely.
Previously, I was using the Chinook artist related DB: via MySQL
MySQL BareMetal Installation | ubuntu CLI 👇
sudo apt update
sudo apt install mysql-server -y
sudo systemctl start mysql
sudo systemctl status mysql
sudo systemctl enable mysql  # Start MySQL on boot

sudo mysql -u root -p
# mysql --version # Output: mysql Ver 8.0.40-0ubuntu0.24.04.1 for Linux on x86_64 ((Ubuntu))systemctl list-units --type=service #you will see mysql there
sudo systemctl stop mysql #if you stop it
lsof -i :3306 #this will be cleared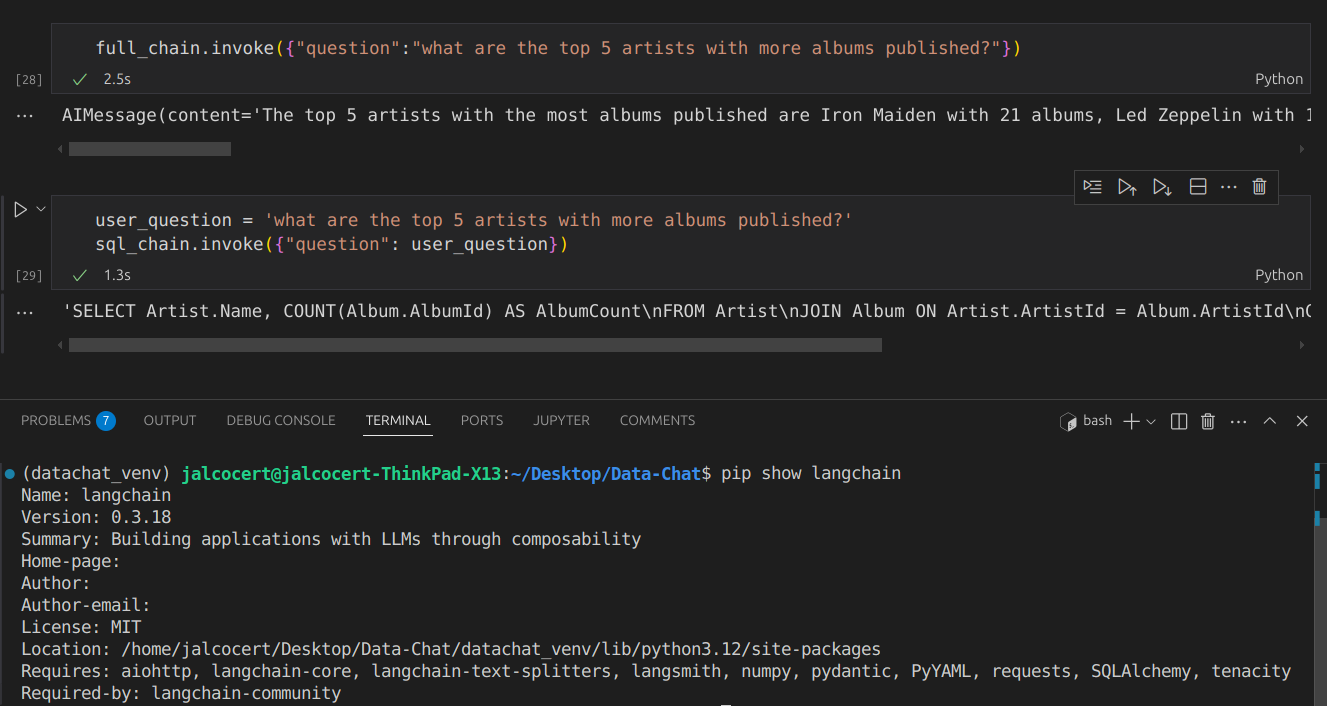
But I want to try couple new things:
- Tt will be PGSql this time and looked with Perplexity help some new sample datasets.
git clone https://github.com/JAlcocerT/Home-Lab
cd postgresql
sudo docker compose up -d
##sudo docker compose logs
You should see something like:
PostgreSQL init process complete; ready for start up.
postgres_container  |
postgres_container  | 2026-01-08 11:22:32.469 UTC [1] LOG:  starting PostgreSQL 16.11 on x86_64-pc-linux-musl, compiled by gcc (Alpine 15.2.0) 15.2.0, 64-bit
postgres_container  | 2026-01-08 11:22:32.469 UTC [1] LOG:  listening on IPv4 address "0.0.0.0", port 5432
postgres_container  | 2026-01-08 11:22:32.469 UTC [1] LOG:  listening on IPv6 address "::", port 5432
postgres_container  | 2026-01-08 11:22:32.478 UTC [1] LOG:  listening on Unix socket "/var/run/postgresql/.s.PGSQL.5432"
postgres_container  | 2026-01-08 11:22:32.489 UTC [57] LOG:  database system was shut down at 2026-01-08 11:22:32 UTC
postgres_container | 2026-01-08 11:22:32.498 UTC [1] LOG: database system is ready to accept connections- How about new sample tables?
You can do the Chinook sample with PGSql anyways.
But I bring you few more:
- Using Nortwind DB OLTP
- Going OLAP
- Doing Northwind OLTP to DuckDB
- Transforming Nortwind OLTP to OLAP
- Using real database from other container services
Sample 1
If you followed before the MySQL Chinook sample, here the adaptation to work with pgsql:
curl -L -O https://github.com/lerocha/chinook-database/releases/download/v1.4.5/Chinook_PostgreSql.sql
cat Chinook_PostgreSql.sql | docker exec -i postgres_container psql -U admin -d myapp

docker exec postgres_container psql -U admin -d myapp -c "\l"

docker exec postgres_container psql -U admin -d chinook -c "\dt"

docker exec -it postgres_container psql -U admin -d chinook
#\dt
#SELECT * FROM artist LIMIT 5;
You can see that the data is loaded with any of:
docker exec postgres_container pg_dump -U admin -d chinook --schema-only
#docker exec -it postgres_container psql -U admin -d chinook -c "\d"
See how litle the workflow changes from the previoys mysql to the container based pgostgresql:
![]()
You can get the schema: and feed it further to an agent / openAI call to get additional insights
query = """
SELECT
    table_name,
    column_name,
    data_type
FROM
    information_schema.columns
WHERE
    table_schema = 'public'
ORDER BY
    table_name, ordinal_position;
"""
print(db.run(query))
Like… getting a quick ER mermaid diagram generated
Sample 2 - OLTP
Northwind is a classic OLTP (Online Transactional Processing) database.
It is designed for daily business operations (CRUD) rather than deep analytical history.
| Feature | OLTP (Northwind) | OLAP (Data Warehouse) |
|---|---|---|
| Primary Goal | Data Integrity & Transaction Speed | Complex Reporting & Business Intelligence |
| Schema Design | Normalized (Split into many tables) | Denormalized (Star or Snowflake schema) |
| Typical Query | Fast lookups / Single record updates | Multi-year aggregations / Large scans |
| Redundancy | Low (saves space, prevents errors) | High (optimized for read speed) |
# 1. Download the SQL file
curl -O https://raw.githubusercontent.com/pthom/northwind_psql/master/northwind.sql

# 2. Create the database
#psql -U postgres -c "CREATE DATABASE northwind;"
docker exec -it postgres_container psql -U admin -d postgres -c "CREATE DATABASE northwind;"

# 3. Import the data
#psql -U postgres -d northwind -f northwind.sql
cat northwind.sql | docker exec -i postgres_container psql -U admin -d northwind
After doing that, see that we have now not only Chinook, but also NorthWind available:
docker exec postgres_container psql -U admin -d postgres -c "\l" Name | Owner | Encoding | Locale Provider | Collate | Ctype | ICU Locale | ICU Rules | Access privileges
-----------+-------+----------+-----------------+------------+------------+------------+-----------+-------------------
chinook | admin | UTF8 | libc | en_US.utf8 | en_US.utf8 | | |
myapp | admin | UTF8 | libc | en_US.utf8 | en_US.utf8 | | |
northwind | admin | UTF8 | libc | en_US.utf8 | en_US.utf8 | | |
postgres | admin | UTF8 | libc | en_US.utf8 | en_US.utf8 | | | Unlike the Chinook script, most
northwind.sqlscripts do not contain a CREATE DATABASE command inside them, which is why we create it manually in Step 1 first. This ensures it doesn’t accidentally overwrite your other data.
We need to adapt the connection so that langchain can connect to it:
# To talk to Northwind
northwind_uri = 'postgresql://admin:securepassword@localhost:5432/northwind'

# To talk to Chinook
#chinook_uri = 'postgresql://admin:securepassword@localhost:5432/chinook'
Northwind is the industry-standard “Hello World” for e-commerce, but it is a product of the 1990s.
While it lacks modern features like SEO metadata or JSON blobs for flexible attributes, its core logic (Orders → Items → Products) remains the foundation of almost every online store today.
Typical Logic: Almost every e-commerce system today still uses the core logic found in Northwind: Customers place Orders, which have Order Items linked to Products.
Typical Modern Implementation: A real-world e-commerce DB today would include things Northwind is missing, such as:
- User Authentication: Password hashes, session tokens, and roles.
- Variants: Handling a single product with different sizes, colors, or materials.
- Digital Goods: Logic for download links and licenses.
- Flexibility: Modern databases often use
JSONBcolumns to store arbitrary product specifications without needing a massive table. - Marketing: Complexity like tiered discounts, coupon codes, and loyalty points.
| Feature | OLTP (Northwind) | OLAP (Data Warehouse) |
|---|---|---|
| Primary Goal | Data Integrity & Transaction Speed | Complex Reporting & Business Intelligence |
| Schema Design | Normalized (Split into many tables) | Denormalized (Star or Snowflake schema) |
| Typical Query | Fast lookups / Single record updates | Multi-year aggregations / Large scans |
| Redundancy | Low (saves space, prevents errors) | High (optimized for read speed) |
To use Northwind for advanced analytics (OLAP), you would typically transform this normalized schema into a Star Schema with a central Fact_Sales table connected to various “Dimension” tables (Time, Product, Employee, Customer).
Sample 3 - OLAP
DuckDB, PostgreSQL, and ClickHouse serve overlapping but distinct roles: DuckDB for embedded/local OLAP analysis, PostgreSQL for versatile OLTP/OLAP hybrid (especially with extensions), and ClickHouse for high-scale distributed OLAP.
| Aspect | DuckDB | PostgreSQL | ClickHouse |
|---|---|---|---|
| Architecture | In-process, embedded (no server), columnar OLAP | Client-server, row-based OLTP (OLAP via Citus/ TimescaleDB) | Distributed columnar OLAP server |
| Best For | Local notebooks, prototyping, <50GB analytics | Transactions + moderate analytics, e-com apps | Massive real-time analytics (>TB), dashboards |
| Query Speed (OLAP) | Excels on complex joins/small-medium data; vectorized | Good with indexes/extensions; slower on pure analytics | 10-100x faster aggregations on large data |
| Scalability | Single-node only | Vertical + sharding (Citus) | Horizontal clustering, petabyte-scale |
| Resource Use | Ultra-light (MBs RAM), in-memory option | Heavier (server overhead) | Optimized compression, high concurrency |
| Self-Hosting | pip install duckdb; file-based | Docker Postgres | Docker cluster; steeper ops |
| E-com Fit | Quick sales analysis on exports | Full stack (Medusa.js DB) | High-volume orders/events |
DuckDB beats Postgres on pure OLAP speed for local work but lacks transactions/HA.
ClickHouse crushes both on scale but skips OLTP.
Performance Benchmarks (OLAP Queries)
- Small-Medium Data (<10GB): DuckDB often fastest (e.g., JOINs 2-5x Postgres).
- Large Data (TB+): ClickHouse dominates (9,000x JSON scans vs DuckDB/Postgres).
- E-com Example (orders aggregation): ClickHouse > DuckDB > Postgres.
Use Cases for Your Stack
- DuckDB: Prototype text-to-SQL/PyGWalker on Northwind dumps. Embed in Astro for static sites.
- Postgres: Production OSS e-com (control DB container), Metabase native.
- ClickHouse: Scale dividend analytics or high-traffic shop events.
Hybrid Pg OLTP to DuckDB
Hybrid: Postgres OLTP → ETL to DuckDB/ClickHouse for analytics.
import duckdb

# 1. Connection settings for your Postgres container
pg_conn_str = "host=localhost user=admin password=securepassword port=5432 dbname=northwind"
#...![]()
This “Hybrid” approach gives you the best of both worlds: PostgreSQL for safe data storage (OLTP) and DuckDB for lightning-fast reports (OLAP).
DuckDB loads only the columns it needs into RAM (vectorized processing), spilling to disk for huge datasets. Redis requires everything in RAM upfront.
DuckDB = “SQLite for analytics” (embedded, disk-based).
Redis = “in-memory cache/broker”.
Completely different categories despite both being fast.
PG OLTP to OLAP
Keeping postgreSQL as the center of the conversation.
In a production environment, you typically have two separate database instances (or schemas).
graph LR
    A[Postgres OLTP
'Production'] -- 1. Extract
(Every Night) --> B(ETL Script / Tool)
    B -- 2. Transform
(De-normalize) --> C[Postgres OLAP
'Data Warehouse']
    C -- 3. Query --> D[Dashboard / BI Tool]
docker exec -it postgres_container psql -U admin -d postgres -c "DROP DATABASE northwind_warehouse;"
for t in customers categories products orders order_details; do \
docker exec -i postgres_container pg_dump -U admin -d northwind -t $t | \
docker exec -i postgres_container psql -U admin -d northwind_warehouse; \
done
docker exec -it postgres_container psql -U admin -d postgres -c "CREATE DATABASE northwind_warehouse;"Data Content Verification
Check if the dimension data (like customers) arrived correctly:
docker exec -it postgres_container psql -U admin -d northwind_warehouse -c "SELECT customer_id, company_name, contact_name, city FROM customers LIMIT 5;"Query Verification
A “Healthy” Star Schema allows you to run a query that touches the Fact table and filters by any Dimension.
If this query works, your Star Schema is correctly configured:
docker exec -it postgres_container psql -U admin -d northwind_warehouse -c "
SELECT
    c.category_name,
    cust.company_name,
    SUM(od.quantity) as total_sold
FROM order_details od
JOIN products p ON od.product_id = p.product_id
JOIN categories c ON p.category_id = c.category_id
JOIN orders o ON od.order_id = o.order_id
JOIN customers cust ON o.customer_id = cust.customer_id
GROUP BY c.category_name, cust.company_name
LIMIT 5;
"
Based on the query below:
docker exec -it postgres_container psql -U admin -d northwind_warehouse -c "
SELECT
    tc.table_name AS source_table,
    kcu.column_name AS source_column,
    ccu.table_name AS target_table,
    ccu.column_name AS target_column
FROM
    information_schema.table_constraints AS tc
    JOIN information_schema.key_column_usage AS kcu
      ON tc.constraint_name = kcu.constraint_name
      AND tc.table_schema = kcu.table_schema
    JOIN information_schema.constraint_column_usage AS ccu
      ON ccu.constraint_name = tc.constraint_name
      AND ccu.table_schema = tc.table_schema
WHERE tc.constraint_type = 'FOREIGN KEY'
  AND tc.table_schema = 'public';
"
You can get to see the snowflake schema of the OLAP design:
erDiagram
    "order_details" }o--|| "orders" : order_id
    "order_details" }o--|| "products" : product_id
    "orders" }o--|| "customers" : customer_id
    "products" }o--|| "categories" : category_id
[!NOTE] Why your warehouse is a Snowflake: In your
northwind_warehouse, thecategoriestable doesn’t connect to the center (order_details). Instead, it connects toproducts. This “branching” makes it a Snowflake.
To make this even more PRO: consider setting up a medallion architecture when doing oltp2olap
graph LR
    A[Postgres OLTP Prod] -- 1. Ingest --> B[BRONZE: Raw]
    B -- 2. Clean/Join --> C[SILVER: Cleaned]
    C -- 3. Aggregate --> D[GOLD: Star Schema]
    D -- 4. Connect --> E[Dashboard]
Sample 4 - Connecting to running services
Like any of these services that you can tinker with and selfhost.
These are 2 examples that are having remote databases we can connect to.
We will be connecting to copies of such dbs to the postgres instance we have spinned locally to avoid problems
Or to have some marketing around this as: analytical reflection of the OLTP data
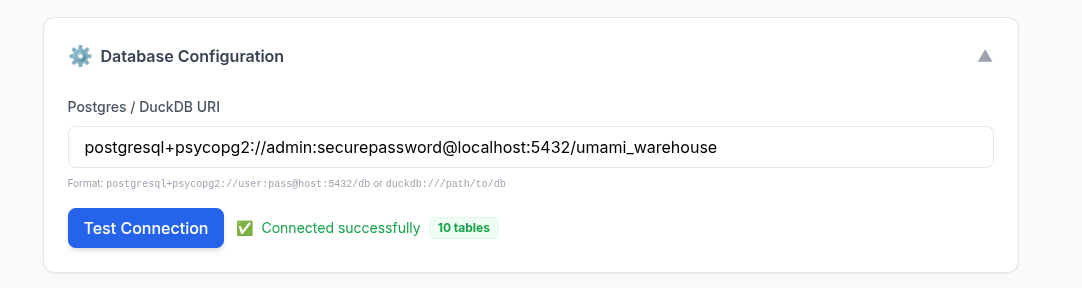
Umami
Umami works with a postgres database, as you can see at its configuration.
I got it working at my home-lab at: 192.168.1.2 in a container called umamiweban-db-1
To avoid messing up with my production web analytics database, ill make a copy:
docker exec -it postgres_container psql -U admin -d postgres -c "CREATE DATABASE umami_warehouse;"Before pushing data, lets see whats inside of it.
Use this to jump directly into the remote database CLI from your local terminal:
ssh -t jalcocert@192.168.1.2 "docker exec -it umamiweban-db-1 psql -U umami -d umami"
#\dt
#               List of relations
#  Schema |        Name        | Type  | Owner
# --------+--------------------+-------+-------
#  public | _prisma_migrations | table | umami
#  public | event_data         | table | umami
#  public | report             | table | umami
#  public | session            | table | umami
#  public | session_data       | table | umami
#  public | team               | table | umami
#  public | team_user          | table | umami
#  public | user               | table | umami
#  public | website            | table | umami
#  public | website_event      | table | umami
The “Remote ETL” Pipe (Pull Data to Umami-Warehouse)
Use this to extract data from the remote server and load it directly into your local dedicated warehouse:
ssh jalcocert@192.168.1.2 "docker exec -e PGPASSWORD='your_umami_db_password' umamiweban-db-1 pg_dump -U umami -d umami" | \
docker exec -i postgres_container psql -U admin -d umami_warehouse
#see that you now have umami_warehouse
#docker exec postgres_container psql -U admin -d postgres -c "\l"
#docker exec -it postgres_container psql -U admin -d umami_warehouse -c "\dt"
This piping happens over the network. You don’t need to save any intermediate files!
Full Schema Report (Columns & Types):
docker exec -it postgres_container psql -U admin -d umami_warehouse -c "
SELECT
    table_name,
    column_name,
    data_type
FROM information_schema.columns
WHERE table_schema = 'public'
ORDER BY table_name, ordinal_position;
"
erDiagram
"website_event" }o--|| "website" : website_id
"website_event" }o--|| "session" : session_id
"session" }o--|| "website" : website_id
"website" ||--o{ "user" : user_id
"website" ||--o{ "team" : team_id
"team_user" }o--|| "team" : team_id
"team_user" }o--|| "user" : user_id
"event_data" }o--|| "website_event" : website_event_id
"session_data" }o--|| "session" : session_iddocker exec -it postgres_container psql -U admin -d umami_warehouse -c "
SELECT
w.name as site,
s.browser,
e.event_id
FROM website w
JOIN session s ON s.website_id = w.website_id
JOIN website_event e ON e.session_id = s.session_id
LIMIT 5;"
# docker exec -it postgres_container psql -U admin -d umami_warehouse -c "
# SELECT w.name, COUNT(e.event_id) as total_events
# FROM website_event e
# JOIN website w ON e.website_id = w.website_id
# GROUP BY w.name;"
# name | total_events
# -------------------------------+--------------
# fosseng | 68013
# JAlcocerTech | Astro | 49
# jalcocert blog github | 7890Which is equivalent to do so via Interactive Shell within the container:
docker exec -it postgres_container psql -U admin -d umami_warehouse-- Example: Count events per Website Name
SELECT w.name, COUNT(e.event_id) as total_events
FROM website_event e
JOIN website w ON e.website_id = w.website_id
GROUP BY w.name;See the magic in action:
![]()
full_chain.invoke({"question":"What it is the most popular website visited in the database for the last 24h?I need its name and the total visits"})Commento
Same with Commento, its setup uses a postgresdb here.
And previously on this post, I made some sample queries to know when someone commented, as I didnt see any alerting feature.
So if you got a website with commento plugged in, you will like this.
ssh -t jalcocert@192.168.1.2 "docker exec -it commento_db-foss psql -U commento -d commento"

#\dt
#\c commento

#                List of relations
#  Schema |       Name        | Type  |  Owner
# --------+-------------------+-------+----------
#  public | commenters        | table | commento
#  public | commentersessions | table | commento
#  public | comments          | table | commento
#  public | config            | table | commento
#  public | domains           | table | commento
#  public | emails            | table | commento
#  public | exports           | table | commento
#  public | migrations        | table | commento
#  public | moderators        | table | commento
#  public | ownerconfirmhexes | table | commento
#  public | owners            | table | commento
#  public | ownersessions     | table | commento
#  public | pages             | table | commento
#  public | resethexes        | table | commento
#  public | ssotokens         | table | commento
#  public | views             | table | commento
#  public | votes             | table | commento
Run a specific query and exit (The “CLI One-Liner”): see the data without entering an interactive shell, use the -c flag
ssh -t jalcocert@192.168.1.2 "docker exec -it commento_db-foss psql -U commento -d commento -c 'SELECT * FROM comments;'"Pro-Tips for Remote Queries
A. Handling Wide Output (Expanded Mode)
If your table is very wide (like the one you just saw in Commento), the output gets “wrapped” and hard to read.
Use the -x flag or \x on; to flip the table 90 degrees:
ssh -t jalcocert@192.168.1.2 "docker exec -it commento_db-foss psql -U commento -d commento -c 'SELECT * FROM comments;' -x"Do a copy of the production commento database to see the magic in action:
Step 1: Create the target database locally
docker exec -it postgres_container psql -U admin -d postgres -c "CREATE DATABASE commento_copy;"
#ssh jalcocert@192.168.1.2 "docker exec commento_db-foss psql -U commento -d commento -c \"COPY (SELECT creationdate, markdown FROM comments ORDER BY creationdate DESC LIMIT 10) TO STDOUT WITH CSV HEADER;\"" > latest_comments.csv
Step 2: Run the remote-to-local pipe
ssh jalcocert@192.168.1.2 "docker exec -e PGPASSWORD='commento' commento_db-foss pg_dump -U commento -d commento" | \
docker exec -i postgres_container psql -U admin -d commento_copy
#see that you now have commento_copy
#docker exec postgres_container psql -U admin -d postgres -c "\l"
#docker exec -it postgres_container psql -U admin -d commento_copy -c "\dt"
#ssh -t jalcocert@192.168.1.2 "docker exec -it commento_db-foss psql -U commento -d commento -c 'SELECT creationdate, markdown FROM comments ORDER BY creationdate DESC LIMIT 2;'"
[!TIP] This is the ultimate “Lazy Developer” ETL—no files, no exports, just a direct stream of data from one server to another.
full_chain.invoke({"question":"What are the latest 5 comments?"})
full_chain.invoke({"question":"What the user name who commented about mermaidviewer?"})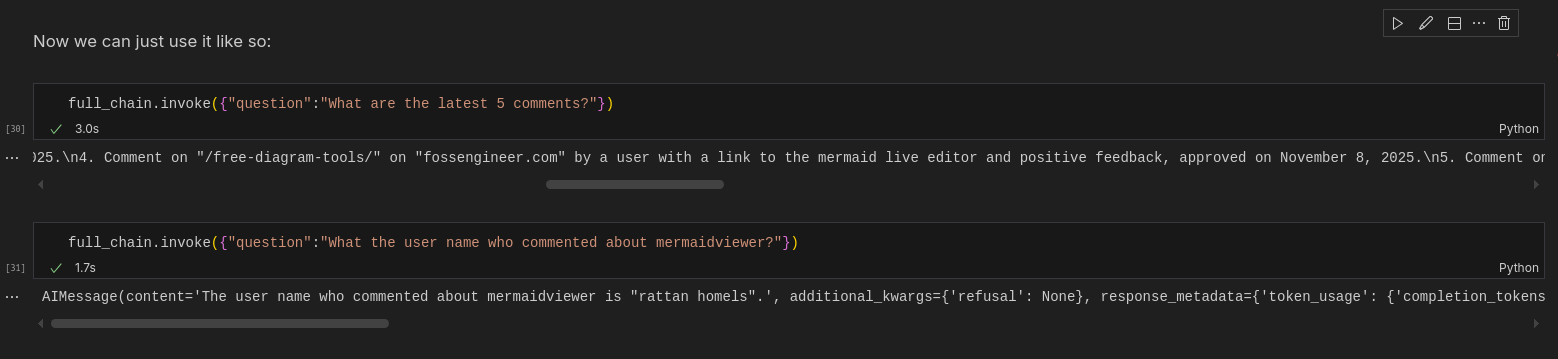
![]()
UI Wrapper
To go from a python notebook / terminal / script to something that is more non tech user friendly, we need a UI.
That’s where the power of vibe coding kicks in, together with a new project:

The natural step is clear: lets wrap that backend logic wihin a UI.
because all we need is to have a connection to a DB and…questions:
from langchain_db_qna import SQLChatBackend
#from langchain_community.utilities import SQLDatabase

# postgresql://{USER}:{PASSWORD}@{HOST}:{PORT}/{DATABASE}
postgresql_uri = 'postgresql://admin:securepassword@localhost:5432/commento_copy'

db = SQLDatabase.from_uri(postgresql_uri)

backend = SQLChatBackend(db_uri=postgresql_uri)
sql = backend.generate_sql("Who commented last?")
answer = backend.ask("Who commented last?")
Startging a repo for pnp D&A 🚀
#sudo apt install gh
gh auth login
gh repo create langchain-db-ui --private --source=. --remote=origin --push

#git init && git add . && git commit -m "Initial commit: langchain x db x ui" && gh repo create langchain-db-ui --private --source=. --remote=origin --push
As recently, I started with: a BRD, some clarifications, then a development plan.
PS: You dont need 1000h of prompt engineering to do so
PS2: as do my presentations as code, I put on the same repo some ppt skeleton using the same agentic IDE conversation.
The vibe coding took 41 minutes, taking into consideration that claude was not so collaborative via antigravity, and I went with Gemini 3 Flash.
The Technical Stack & Specifications?
| Requirement | Specification | Clarification / Decision |
|---|---|---|
| Frontend Framework | React + Vite | Tab favicon and OG metadata configured in index.html. |
| Styling/UI Library | Tailwind CSS | Utility-first styling for premium design & performance. |
| Backend/Database | FastAPI (Python) | Stateless API using SQLChatBackend with PostgreSQL support. |
| Authentication | Environment-based (v1) | Simple .env configuration; multi-user auth deferred to other iterations |
| Development Tools | Makefile / Docker | Standardized commands for baremetal and container-based dev. |
Component Details
- Frontend:
- State Management: React Context API
- HTTP Client: Axios
- Backend:
- Logic:
sql_backend.py - ORM/Interface: LangChain SQLDatabase
- Logic:
- Containerization: Docker Compose (v2)
- Secrets:
.envfile forDB_URIandOPENAI_API_KEY
AI/BI
If you are kind of stucked in your D&A career, shaping one of this will be good for your portfolio.
Time to demonstrate once again that adaptability skills for the transition that we are in.
Apache v2 | An open source alternative to Tableau. Embeddable visual analytic
See also this section.
Conclusions
Could this be attractive to people that have some e-commerce and dont have the bugdet to hire an BI/analyst to see whats working/whats not?
One more time, its all about the friction to PAY versus the friction to DO.
When you are done, you can clear up with:
#docker stop $(docker ps -a -q) #stop all
#docker system df
#docker system prune -a --volumes -f
The Related Tech Talk
To unify my workflow/efforts, I’ve moved my tech talk creation from: structured like so
git clone --depth 1 --single-branch -b logtojseauth https://github.com/JAlcocerT/slidev-editor #just current status
#git clone https://github.com/JAlcocerT/slidev-editor
#git branch -a
#git checkout -b logtojseauth main
As part of my consulting repository: the responsible for consulting.jalcocertech.com
git clone https://github.com/JAlcocerT/selfhosted-landing
cd y2026-tech-talks/langchain-postgres
#npm run dev
#npm i -D playwright-chromium
#npm run export #default as pdf!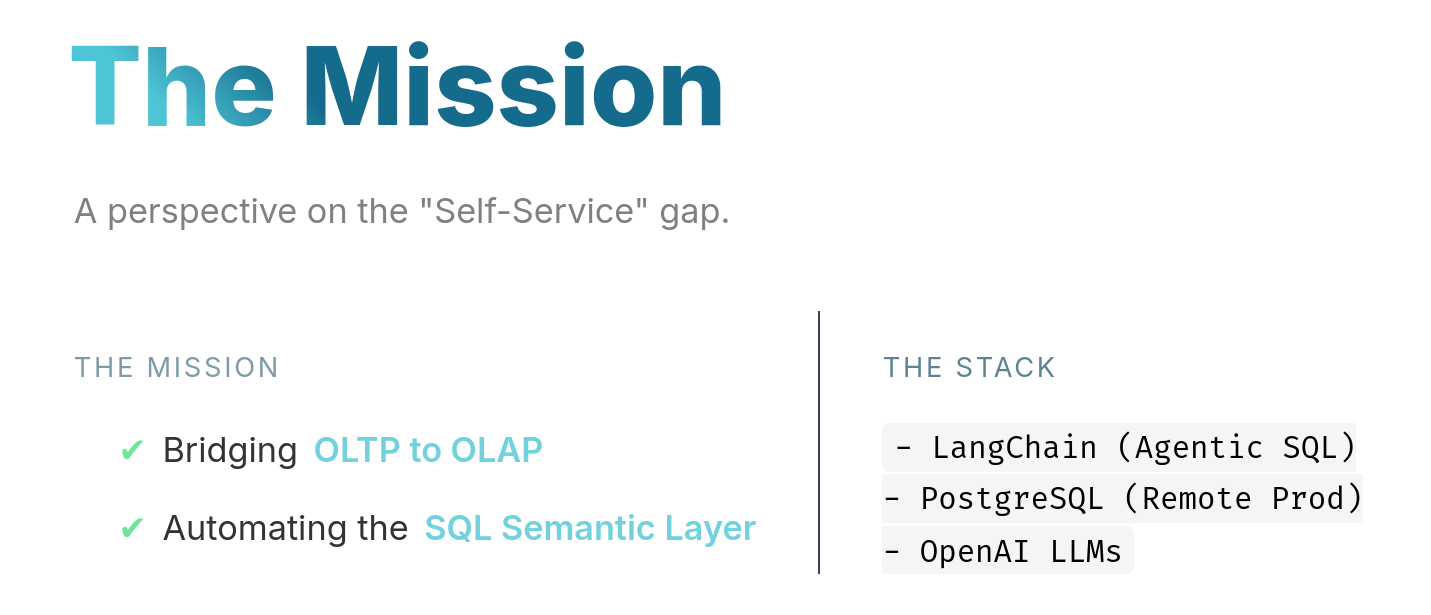
This time I used not only components and public images, but also ./pages to keep the content modular and potentially, re-use it in the future.
npm install chart.js pgI got to know what a composable is, as this case is not as simple as the yfinance slidev component
Also, as the db is not in the browser, I needed to fetch one time the data from pg I didnt wanna create a be API for this
mindmap
  root((Data Concept))
    OLTP
      ::icon(fas fa-database)
      Transactional
      Normalized (3NF)
      Real-time Updates
      Row-based
    OLAP
      ::icon(fas fa-chart-bar)
      Analytical
      Denormalized
      Batch Processing
      Column-based
npm run prefetch # Just fetch data
#node scripts/fetch-data.js #http://localhost:3030/db-data.jsonSee how API vs database driven component differs in this diagram
Next time?
There will be a better setup for this.
These ppt source code and build wont be public like the multichat or the data-chat ppt generated here
You can get such analytic setup done for you: Yea, its private this time :)
This has been more a HOW, than a why or a what.
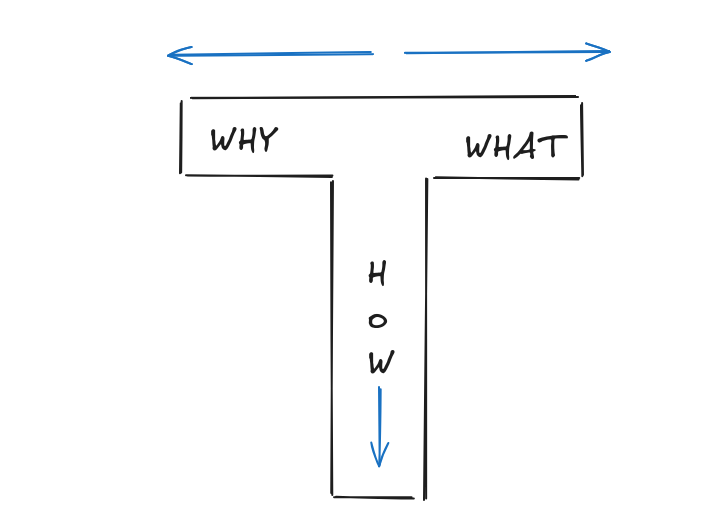
If you got your why’s and what’s in place, but still miss the how: remember bout my tiers
flowchart LR
    %% --- Styles ---
    classDef landing fill:#E3F2FD,stroke:#1976D2,stroke-width:3px,color:#0D47A1;
    classDef steps fill:#F3E5F5,stroke:#7B1FA2,stroke-width:2px,color:#4A148C;
    classDef slider fill:#FFF3E0,stroke:#F57C00,stroke-width:2px,color:#E65100;
    classDef free fill:#E8F5E9,stroke:#388E3C,stroke-width:3px,color:#1B5E20;
    classDef consult fill:#FFECB3,stroke:#FFA000,stroke-width:3px,color:#FF6F00;
    classDef dfy fill:#FFCDD2,stroke:#D32F2F,stroke-width:3px,color:#B71C1C;

    %% --- Nodes ---
    START("🏠 Landing Page
(Hero + Value Prop)"):::landing
    STEPS("📋 Read Process
(3-Step Guide)"):::steps
    SLIDER("🎚️ Interactive Slider
(Assess Time Value)"):::slider

    FREE("📚 FREE Path
(DIY Guides)"):::free
    CAL("📅 Consulting
(Book Session)"):::consult
    DFY("💎 Done For You
(Premium Service)"):::dfy

    %% --- Flow ---
    START --> STEPS
    STEPS --> SLIDER

    SLIDER -->|"0%
I'm Learning"| FREE
    SLIDER -->|"1-74%
A lot!"| CAL
    SLIDER -->|"75-100%
Lambo Money"| DFY

    %% --- Outcomes ---
    FREE -.->|"Explore FAQ"| END1["📖 Self-Learn"]
    CAL -.->|"Book Time"| END2["🤝 Get Guidance"]
    DFY -.->|"Check Resources"| END3["⚡ Fast Track"]
Go from problem to solution proposal: Get it done
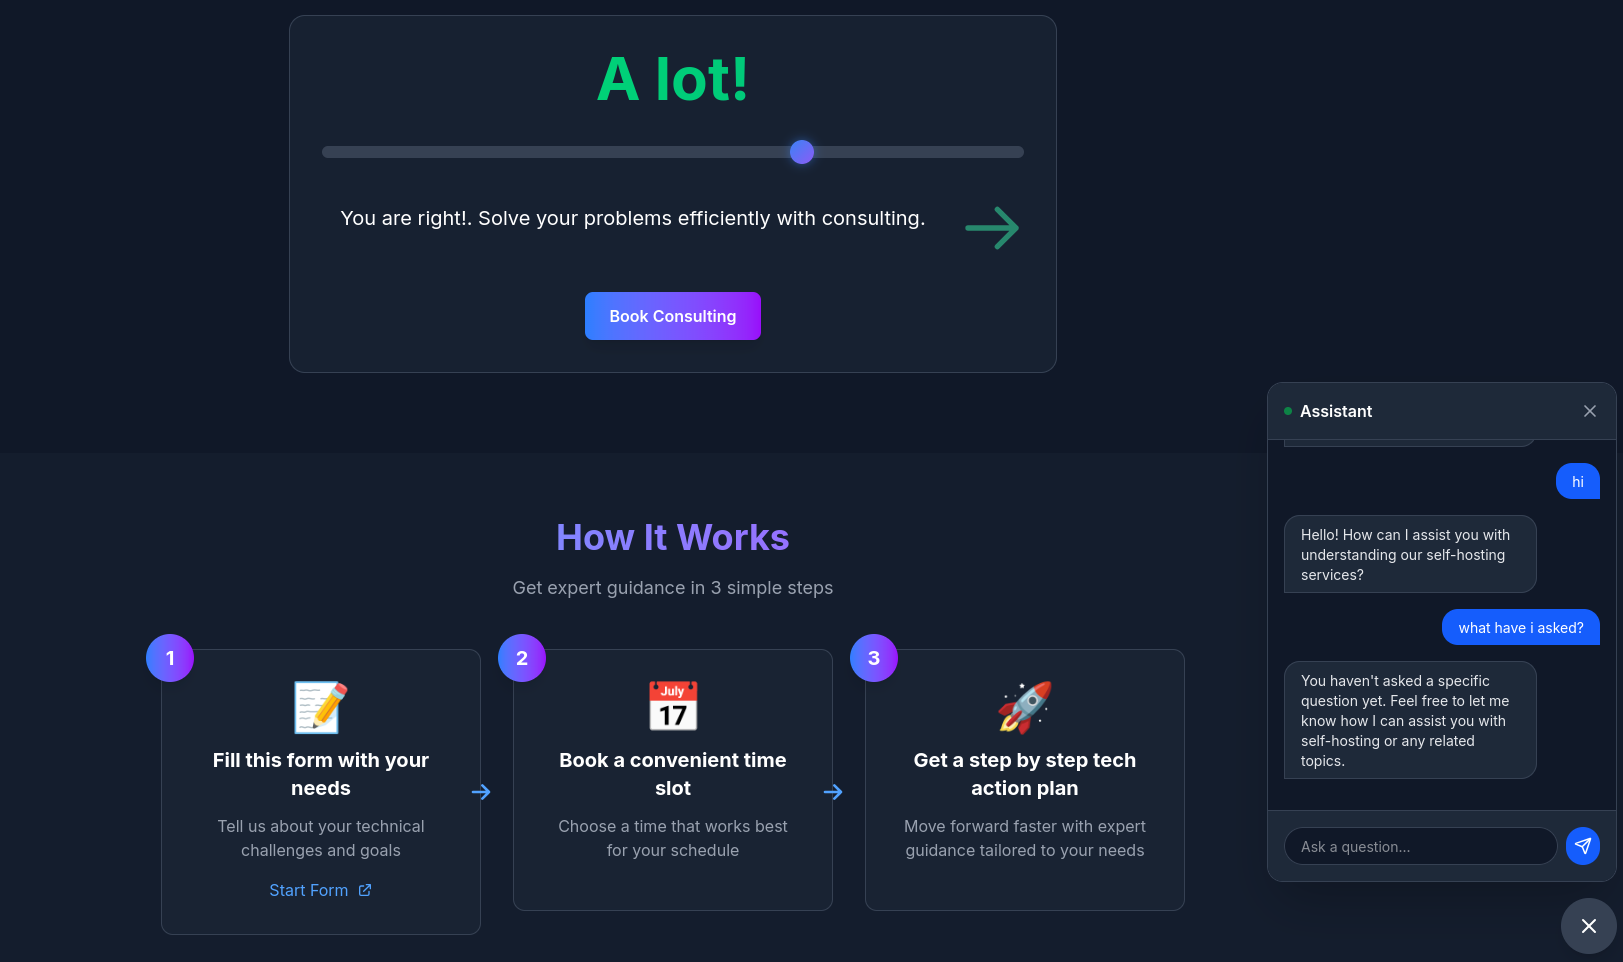 Consulting Services
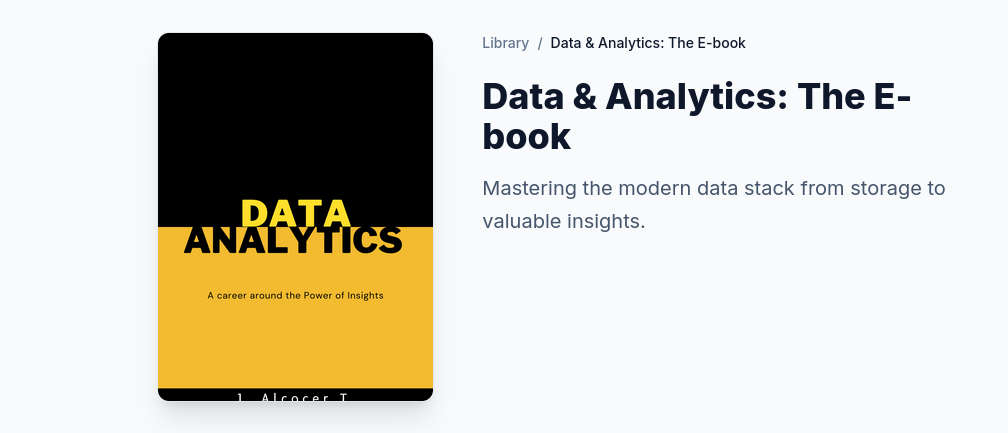 DIY via ebooks
We have gone from:

The previous related session is uploaded here and you can see the latest one here.
To: a vibe coded UI Wrapper, so non tech users can use it confortably
This will be presented to BAs/DEs at another tech talk to motivate them to create.
Just like this:
Next Steps
Find more use cases.
From GenAI BI solutions, to those Connect AI to your CRM.
Understanding Existing solutions
Agpl 3.0 | ⚡️ GenBI (Generative BI) queries any database in natural language, generates accurate SQL (Text-to-SQL), charts (Text-to-Chart), and AI-powered business intelligence in seconds.
Several open-source projects mirror Wren AI’s generative BI (GenBI) focus: natural language → text-to-SQL → auto-charts/dashboards, self-hosted for Postgres/DuckDB e-com stacks.
Wren has a cool flow image that resonates with all a DA should know
FAQ
- https://lmarena.ai/leaderboard
- https://claude.ai/
- https://console.anthropic.com/workbench/
- https://console.groq.com/keys
- https://platform.openai.com/api-keys
D&A Career
When designing your Star Schema in the northwind_warehouse, here is how you classify the tables we just moved:
- The Fact Table:
order_details
This is the “What happened?” table.
It contains the measurements, metrics, or “facts” of a business process.
- Why? It holds the quantity, unit price, and discount—numeric values that you can sum, average, or count.
- Key characteristic: It’s usually the “center” of your schema and has the most rows.
- The Dimension Tables:
products,customers, etc.
These are the “Who, Where, and What?” tables.
They provide the context for the facts.
- Why? They contain descriptive attributes like
product_name,company_name, orcategory_name. - Key characteristic: You use these to FILTER or GROUP your analysis (e.g., “Show revenue by Category”).
| Table | Type | Purpose |
|---|---|---|
| order_details | Fact | Quantitative data (Quantity, Price). |
| orders | Fact / Context | Often combined into the Fact table (Order Date, Ship Country). |
| products | Dimension | Descriptive context (Product Name, Supplier). |
| customers | Dimension | Descriptive context (Company Name, Region). |
| categories | Dimension | Descriptive context (Category Name). |
Pros and Cons of the Star Schema: Why did we just go through all the trouble of migrating these tables?
✅ The Pros (Why we love it for OLAP)
- Query Simplicity: Your SQL queries become much simpler. You usually have one
Facttable and you justJOINtheDimensionsyou need. No more 15-table join nightmares from the Production DB. - Speed (Performance): Most analytical engines (like DuckDB or BI tools) are optimized for this specific “Star” structure. They can filter dimensions very fast.
- User-Friendly: Analysts who don’t know the complex Production code can easily understand
order_details+products. It’s intuitive. - Aggregations: Perfect for calculating “Top Products”, “Monthly Revenue”, or “Customer Growth”.
❌ The Cons (The trade-offs)
- Data Redundancy: You might store the same information twice (e.g., a customer’s name might appear in multiple places if you flatten it too much).
- Maintenance (ETL): You now have to maintain a “Nightly Job” to keep the Star Schema in sync with Production. If the job fails, your reports are outdated.
- Rigidity: It’s great for the questions it was built to answer, but if you suddenly need to see “Inventory Logs” that weren’t migrated, you’re stuck.
graph LR
    subgraph "Relational (OLTP)"
        A[3rd Normal Form
'Production']
    end

    subgraph "Analytical (OLAP)"
        B[Snowflake
'Organized'] --> C[Star Schema
'Fast']
        C --> D[One Flat Table
'Fastest']
    end

    A -- "ETL Transformation" --> B

    style A fill:#f9f,stroke:#333
    style B fill:#bbf,stroke:#333
    style C fill:#bfb,stroke:#333
    style D fill:#fbf,stroke:#333
Star vs. Snowflake Schema
Which one is better? It depends on your priorities.
| Feature | Star Schema | Snowflake Schema (Your Setup) |
|---|---|---|
| Structure | All dimensions link directly to the Fact. | Dimensions are “normalized” (branched). |
| Complexity | Simple (fewest joins). | Complex (more joins needed). |
| Storage | Higher (data is redundant/denormalized). | Lower (data is compact/normalized). |
| Integrity | Lower (Easier to make typos). | Higher (Dimensions use lookup tables). |
[!TIP] Why is Integrity higher in Snowflake? In a Star Schema, you might store the category name directly inside the
productstable. If you want to change “Beverages” to “Drinks”, you have to update 100 rows. If you miss one, you have a typo. In a Snowflake Schema, you change it once in thecategoriestable, and all products instantly reflect the change. This is the power of Normalization.
DuckDB vs SQLITE
The DuckDB-in-Astro build-time static charts pattern is “static site generation with embedded OLAP processing” or “build-time analytics”, not traditional “embedded analytics.”
DuckDB-Astro does static embedding: Pre-computed pies/bars baked into HTML at build/deploy.
No live queries—great for blogs/portfolios, not user-facing dashboards which demand real time data updates.
Duckdb (column) vs sqlite (row)
About some QnA
- Document Logic (The Planning)
- BRD (Business Requirements): Answers “WHY build this?” (The Vision & Goals).
- PRD (Product Requirements): Answers “WHAT are we building?” (The Features & Roadmap).
- FRD (Functional Requirements): Answers “HOW does it work?” (The Technical Logic & CRUDs).
- Data Logic (The Analytics)
- Fact Tables: Answer “WHAT happened (and how much)?”
- Examples:
visit_count,revenue,quantity_sold.
- Examples:
- Dimension Tables: Answer “WHO / WHERE / WHICH context?”
- Examples:
customer_name,product_category,country_origin.
- Examples:
[!TIP] Star Schema Rule of Thumb: Put your Fact (the “What”) in the center and surround it with your Dimensions (the “Context”) to get a perfect 360° view of your data.
Wrenai data stack
Based on the diagram from WrenAI, the architecture represents a modern data stack designed to transform raw information into actionable insights using AI.
The flow, starting with raw data sources and ending with user-facing applications:
graph LR
    %% Data Sources
    subgraph Sources [Data Sources]
        DB1[(MySQL)]
        DB2[(PostgreSQL)]
        DB3[(BigQuery)]
        SaaS([Slack/SaaS])
    end

    %% Core Architecture Layers
    subgraph Architecture [WrenAI Core Engine]
        DL{Data Layer}
        SL{Semantic Layer}
        AL{Agentic Layer}
        RL{Representation Layer}
    end

    %% Output Deliverables
    subgraph Outputs [Output Applications]
        EA[Embedded Analytics]
        DR[Dashboards & Reports]
        CI[Conversational Interface]
    end

    %% Connections
    Sources --> DL
    DL --> SL
    SL --> AL
    AL --> RL
    RL --> EA
    RL --> DR
    RL --> CI

    %% Styling
    style DL fill:#003366,stroke:#fff,color:#fff
    style SL fill:#1e90ff,stroke:#fff,color:#fff
    style AL fill:#003366,stroke:#fff,color:#fff
    style RL fill:#1e90ff,stroke:#fff,color:#fff
style Architecture fill:#f9f9f9,stroke-dasharray: 5 5- Data Layer
This is the foundation. It represents your raw data sources. The icons on the far left (like MySQL, PostgreSQL, BigQuery, and Slack) show that the system connects to various databases and SaaS platforms.
- Role: To ingest and store data in its original form before it is interpreted.
- Semantic Layer
This is one of the most critical parts of the WrenAI workflow.
In raw databases, column names are often cryptic (e.g., cust_rev_2023).
Role: It acts as a “translator” that defines business logic in human terms. It maps technical data to business concepts (e.g., defining exactly how “Monthly Recurring Revenue” is calculated).
Why it matters: It ensures that when an AI or a human asks a question, the system uses a single, consistent definition of truth.
- Agentic Layer
This layer is where the AI (the “Agent”) lives. Instead of just running a static script, an agentic layer uses LLMs (Large Language Models) to “think” through a request.
- Role: It receives a natural language question, looks at the Semantic Layer to understand the data’s meaning, and then decides which tools or queries to run to find the answer.
- Key Feature: It can iterate—if the first query doesn’t work, the agent can self-correct to find the right data.
- Representation Layer
This is the output phase. Once the Agentic Layer has found the answer, the Representation Layer determines how that information is visualized or delivered.
- Role: It formats the data based on the end-user’s needs, whether that is a chart, a text summary, or a table.
End-User Deliverables
The diagram ends with three primary ways users interact with this processed data:
- Embedded Analytics: Pushing these insights directly into other software applications.
- Dashboards & Reports: Traditional visual summaries of Key Performance Indicators (KPIs).
- Conversational Interface: A “Chat with your data” experience where users ask questions in plain English and get immediate answers (the core value of WrenAI).
Would you like me to dive deeper into how the Semantic Layer specifically helps the AI avoid making mistakes?
Whats a composable
Instead of writing database connection logic in every chart component, we centralize it in one place.
This composable:
Manages Database Connections 🔌
- Creates connection pools
- Executes queries
- Cleans up connections properly
Provides Reactive State 📊
data- Query resultsloading- Loading indicatorerror- Error messages
Enables Reusability ♻️
- Use with pie charts, bar charts, line charts, tables, etc.
- Write database logic once, use everywhere