Shipping PyStonks v2 with a friend 🐷
Tl;DR
The historical stock webapp, companion for: https://financeinmotion.fyi
+++ People are doing the classic bait: I finally reach xyz divs a year On reddit with a snapshot of a web app to get traction.
+++ More and cooler yfinance for a ~ PyStocks v2
Intro
Build and be prepared for very low conversions.
People on X with 7k subs are able to convert to 17 paid users for some web apps.
Ready to convert at ~0.2%? like here with this webapp, despite the free CSR calculators
To pull data from yfinance should not be a secret anymore:

Plus also on the initial PyStonks Post, I dedicted time for a yfinance EDA ipynb section.
Bc https://nbformat.readthedocs.io/en/latest/ are great
On my recent pystonks version, I could see how the FastAPI version es more flexible than the PyStocks Streamlit and understandable by LLMs more than Reflex.
While playing very well with SSGs like Astro, unlike Flask or Django.
Now, Im going to take back the collaboration with my friend: btw, he is a PDH.

The Data Model
Even before that: WHAT does this app reply to?
Top Priority:
- Historical Prices of stocks: not only NYSE or NASDAQ, but also companies which are listed in other markets, like Nestle, Unilever or MunichRe
- Historical Dividends
Lift and coast vs DRIP vs DRIP + invest
Nice to have:
Volatility, MDD
Historical EPS, PER and Dividend Payout
Current (and near history) net profit margin
Currency historical exchange rates (EUR<->USD)
Inflation Data
Bring your portfolio
provide for your Portfolio the: historical dividends, confirmed dividends, forecasted dividends (per month/year)
Comparison on a stock/portfolio with a sector: https://finance.yahoo.com/sectors/real-estate/
https://totalrealreturns.com/s/SCHD,VYM,PEP?start=2020-04-23
Buyback ratio (if historical, even better). They get announced, people comment
Volatility div growth and cagr / Yfinance eur usd?
Treemap with market size like https://finviz.com/map.ashx
- https://www.simplysafedividends.com/world-of-dividends/posts/41-2025-dividend-kings-list-all-54-ranked-analyzed a hidden blog to attract SEO
- https://www.tikr.com/
- Bringing data for index funds, like: https://markets.ft.com/data/funds/tearsheet/summary?s=lu0996182563:eur
#so you wont have to get that url xpath imported
#/html/body/div[3]/div[2]/section[1]/div/div/div[1]/div[2]/ul/li[1]/span[2]
=SI.ERROR(SUSTITUIR(importxml(R22; X20); "."; ",");T22)QQ: Nasdaq sp500 one time vs dca 2000 -2015 /// Growth or initial yield? ///
https://www.google.com/finance/quote/.INX:INDEXSP?window=1Morhttps://www.google.com/finance/quote/GOOGL:NASDAQ?window=MAXSee also the cool graph and the table of https://bitcointreasuries.net/defi-and-other
Maybe crypto? https://www.blockchain.com/explorer
Maybe bonds? https://www.interactivebrokers.ie/portal/#/wlms/bond-scanner
Geraldine Weiss method, also known as the dividend-yield theory
Dividend calendar, like https://www.dividendstocks.com/tools/ex-dividend-stock-list/ or https://divvydiary.com/en/calendar
When are the company earnings: https://earningshub.com/
Sitio Web para Datos de Mercado:
- markets.ft.com
With this data model, you will have answers, but also questions:
Wait, the oil is at the same price than 2006 but i pay more for it? https://www.macrotrends.net/2483/brent-crude-oil-price-history
See the BRD where we scoped the project.
Data Modelling Tools for PyStonks
Apache v2 | Data load tool (dlt) is an open source Python library that makes data loading easy 🛠️
DLT can do both depending on how you use it:
Given an API or raw data source, dlt can extract the data, inspect its structure, and automatically create corresponding tables in the destination database.
This is part of its automatic schema detection and creation feature.
When loading raw or semi-structured data, dlt performs data normalization, transforming the input into a consistent, well-structured format suitable for analytics. This often means organizing data into multiple related tables with appropriate schemas.
While dlt focuses on data loading and normalization, it helps create a database schema that supports efficient query and analysis, which aligns with OLAP principles.
However, it primarily focuses on the “load” (L) in ETL/ELT pipelines.
So, in summary, dlt can extract from APIs or raw data, normalize it, and load it into a destination database by generating an appropriate schema to support analytical workloads—effectively enabling OLAP-style data organization.
DLT x yFinance
Data load tool, an open source Python library that makes data loading easy 🛠️
dlt is an open-source Python library that loads data from various, often messy data sources into well-structured, live datasets.
It offers a lightweight interface for extracting data from REST APIs, SQL databases, cloud storage, Python data structures, and many more.
Conclusions
Building a proper data foundation is key for such projects: get a proper data model, then build on top of it
git clone https://github.com/jlleongarcia/PyStocks
cp .env.example .env
make up
#docker stop $(docker ps -a -q) #stop all
#docker system df
#docker system prune -a --volumes -f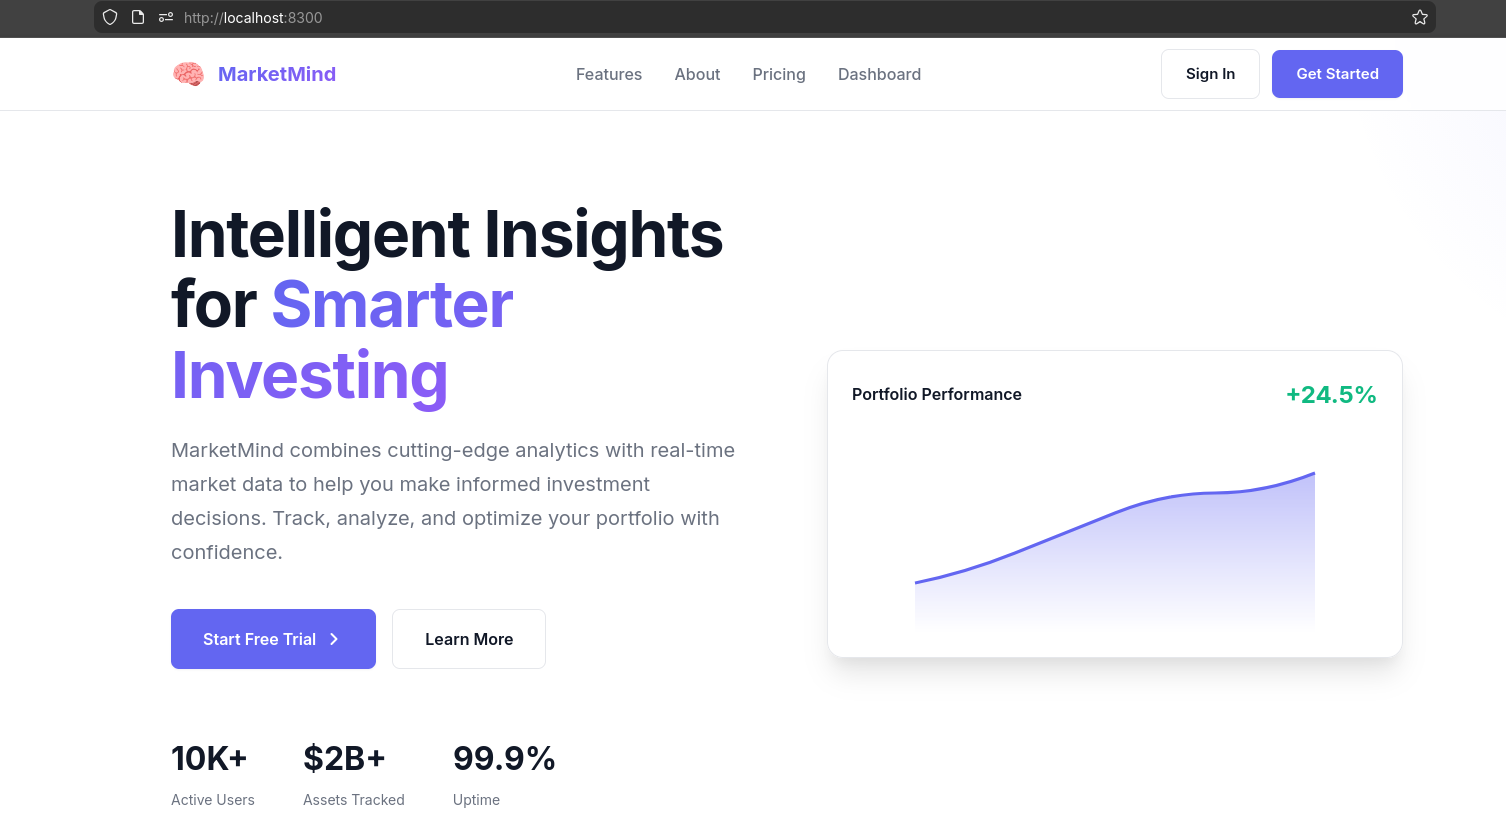
Use streamlit to make quick visuals and layouts for a PoC.
To make it look cooler, vibe code as per those guidelines using any webapp backend framework from Python frameworks like Django/Flask/… or NextJS if you are a web dev.
If you need a proper finance tool, see: https://www.perplexity.ai/finance/XOM?comparing=CVX&period=1y
Before going to https://www.interactivebrokers.ie/sso/Login?RL=1&locale=en_US or https://www.xtb.com/es :)
Having the possibility to export data from famous brokers, get it cleaned automatically and have your portfolio visualized can be great
Many nice to have: for free or for subs
Like having API access, vacations with a world map, or how much do I need to retirement from now
About Debt
Debt is a thing:
=GOOGLEFINANCE("INDEXCBOE:TYX")/1000
=GOOGLEFINANCE("INDEXCBOE:TNX";"price")/1000
=GOOGLEFINANCE("INDEXCBOE:IRX")/1000
IRX is the ticker for the Cboe 13-Week Treasury Bill Index.
- Purpose: It tracks the discount rate of the most recently auctioned 13-week (3-month) U.S. Treasury bills.
- How to read it: The value of the index is typically expressed as the annualized yield multiplied by 10. For example, if the IRX is quoted at 45.20, it represents a yield of approximately 4.52%.
- Significance: Investors monitor IRX as a benchmark for “risk-free” short-term interest rates in the United States.
Here is a one-liner definition for each of those financial KPIs:
- Forward PER: The current stock price divided by the estimated earnings per share (EPS) for the next 12 months.
- Yield Forward: The estimated annual dividend payments for the next year divided by the current stock price.
- PER Last 5Y: The average Price-to-Earnings ratio of the company over the last five fiscal years.
- Percentile 5Y Avg PER: A ranking showing where the current PER stands relative to its historical range over the last five years (0% being the lowest, 100% being the highest).
- Last 5Y Yield: The average annual dividend yield the company has offered over the past five years.
- Percentile 5Y Avg Yield: A ranking showing how the current dividend yield compares to its historical levels over the last five years.
- Yield Growth (1Y, 5Y, 10Y): The compound annual growth rate (CAGR) of the company’s dividend payments over those specific timeframes.
- Shoulder Number: A niche technical or accounting metric, often referring to a specific threshold or “tipping point” in debt-to-equity or valuation models.
- Payout Ratio (Today): The percentage of current earnings being paid out to shareholders as dividends.
- PEG (Price/Earnings to Growth): The PER divided by the expected earnings growth rate, used to determine if a stock is overvalued relative to its growth.
- PEGI: A variation of the PEG ratio that adds the dividend yield to the earnings growth rate to account for total shareholder return.
- PaaP (Price as a Percent of Peak): A measurement of how far the current stock price is trading below its all-time high or 52-week high.
- PaaY (Price as a Percent of Yield): A valuation metric comparing the current price relative to historical dividend yield benchmarks to find “fair value.”
From Data In Motion to PyStonks
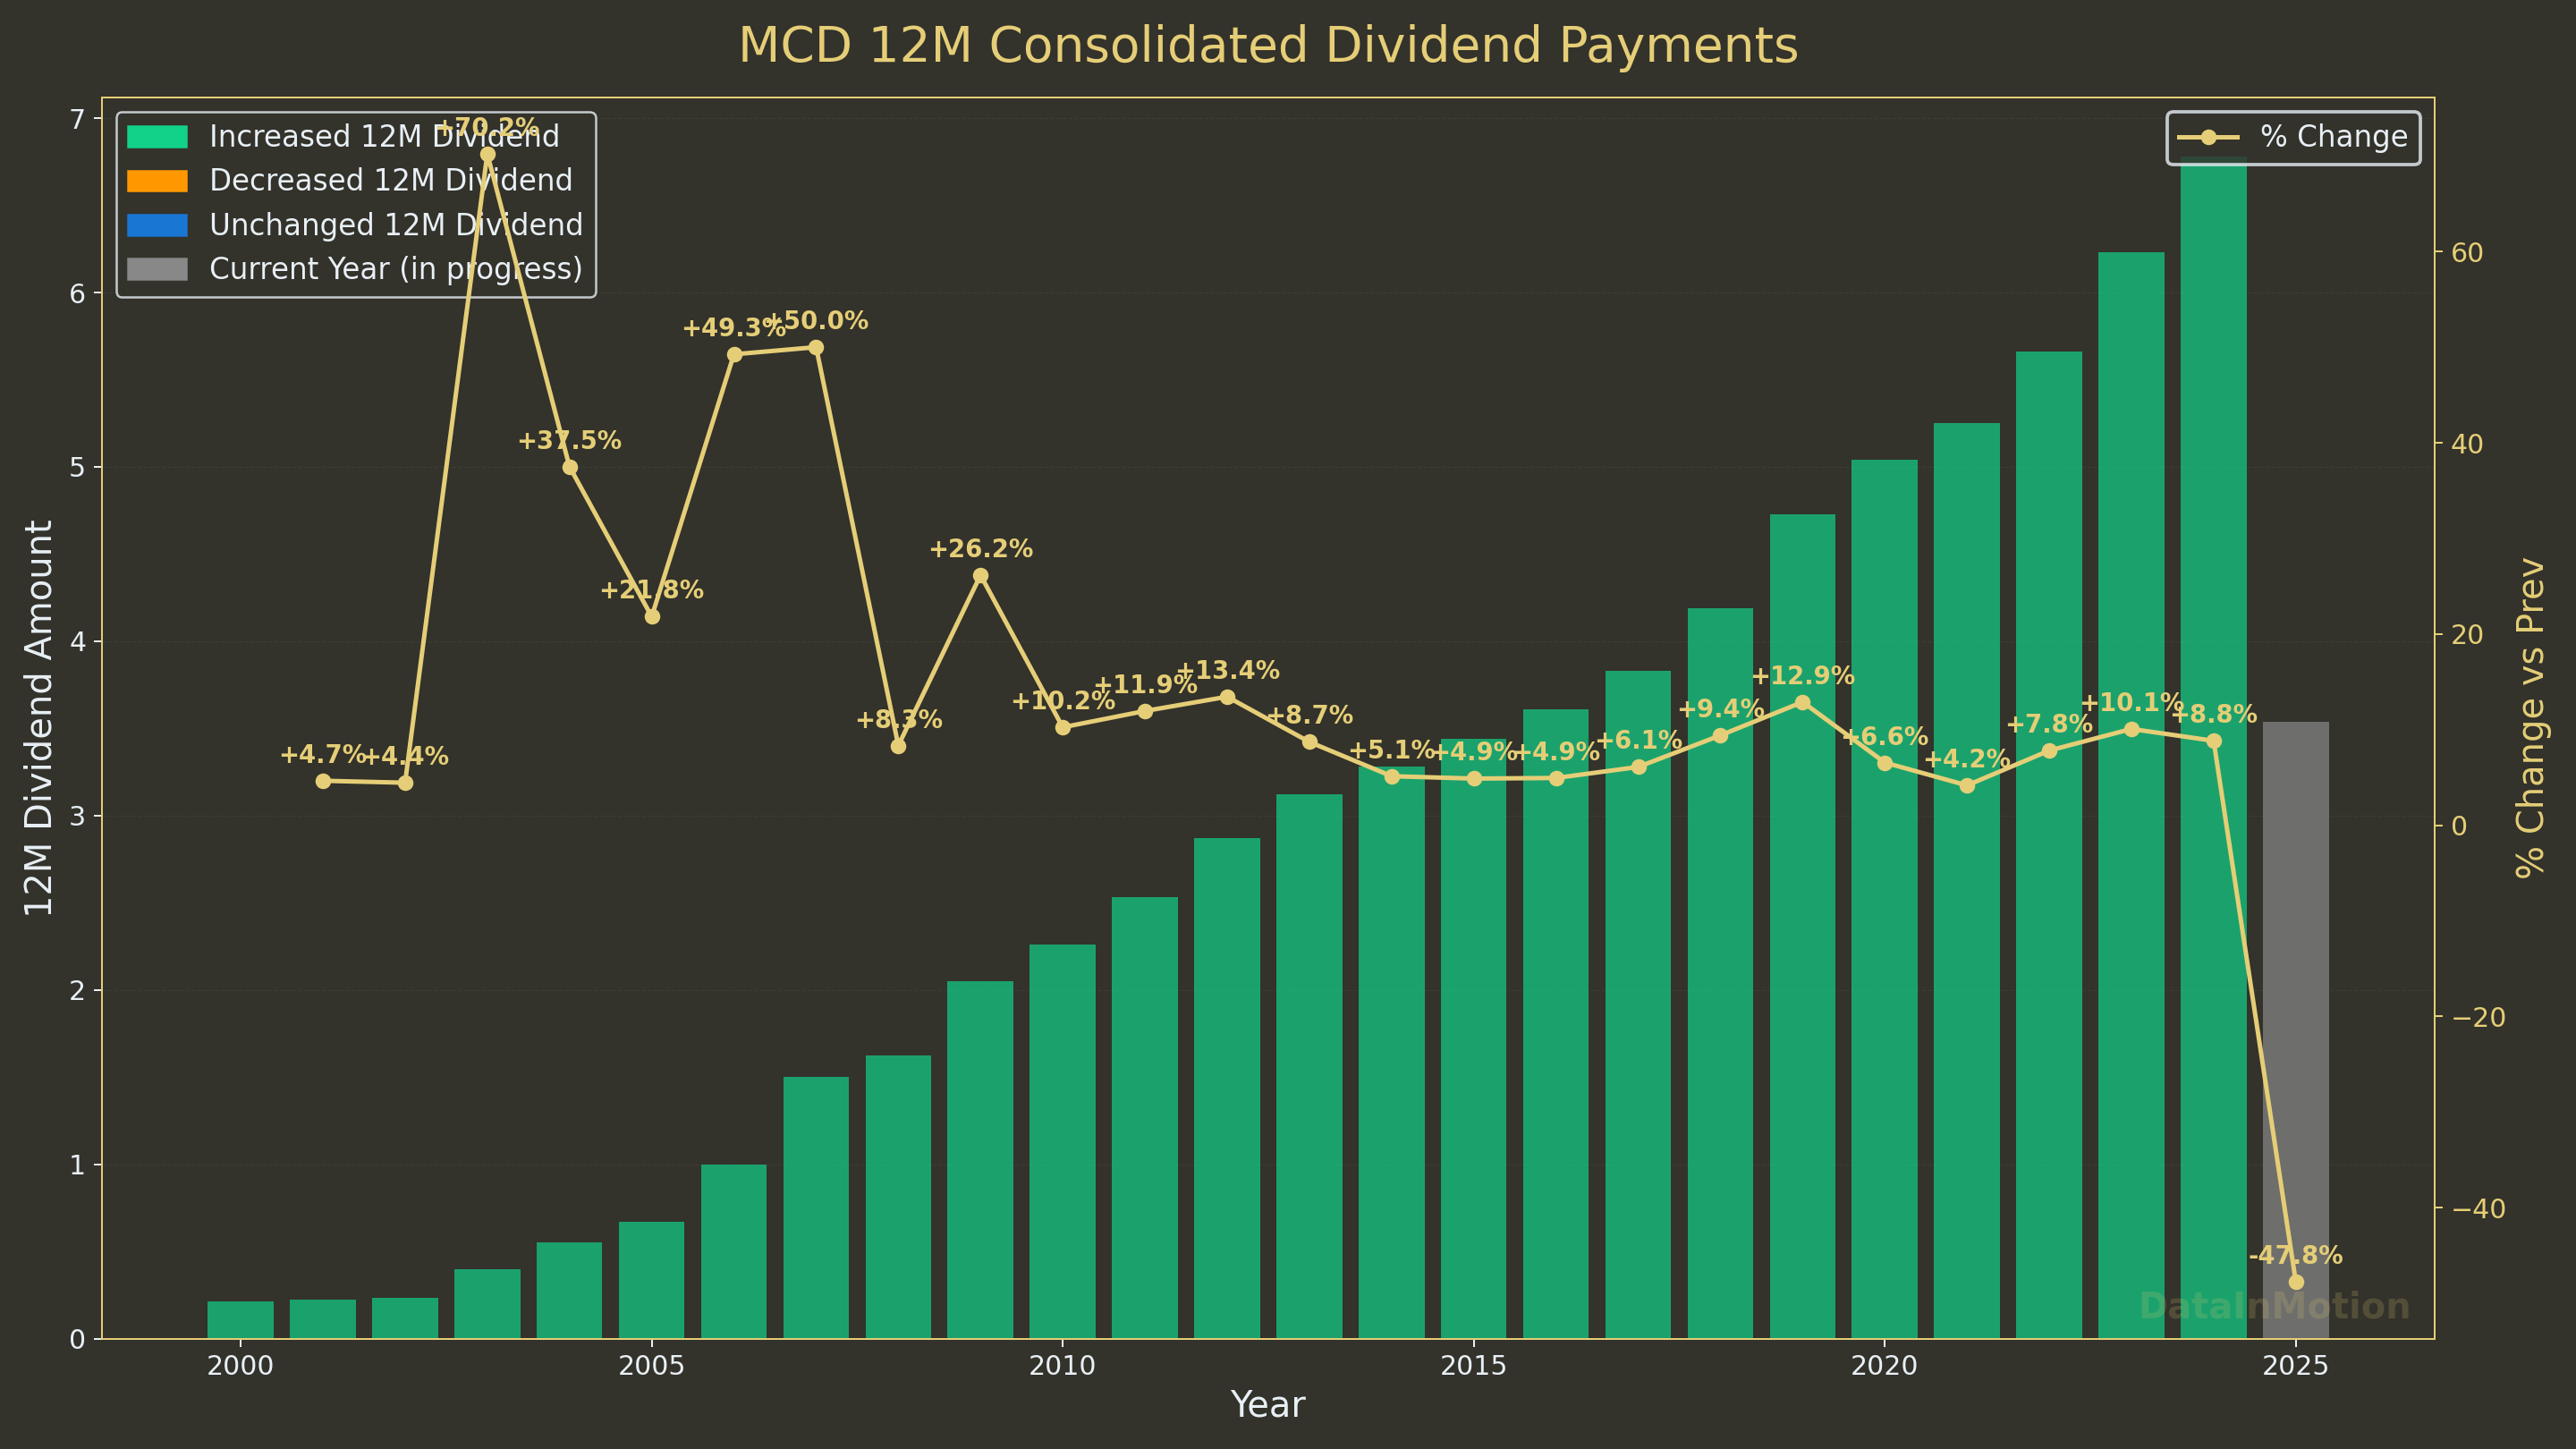
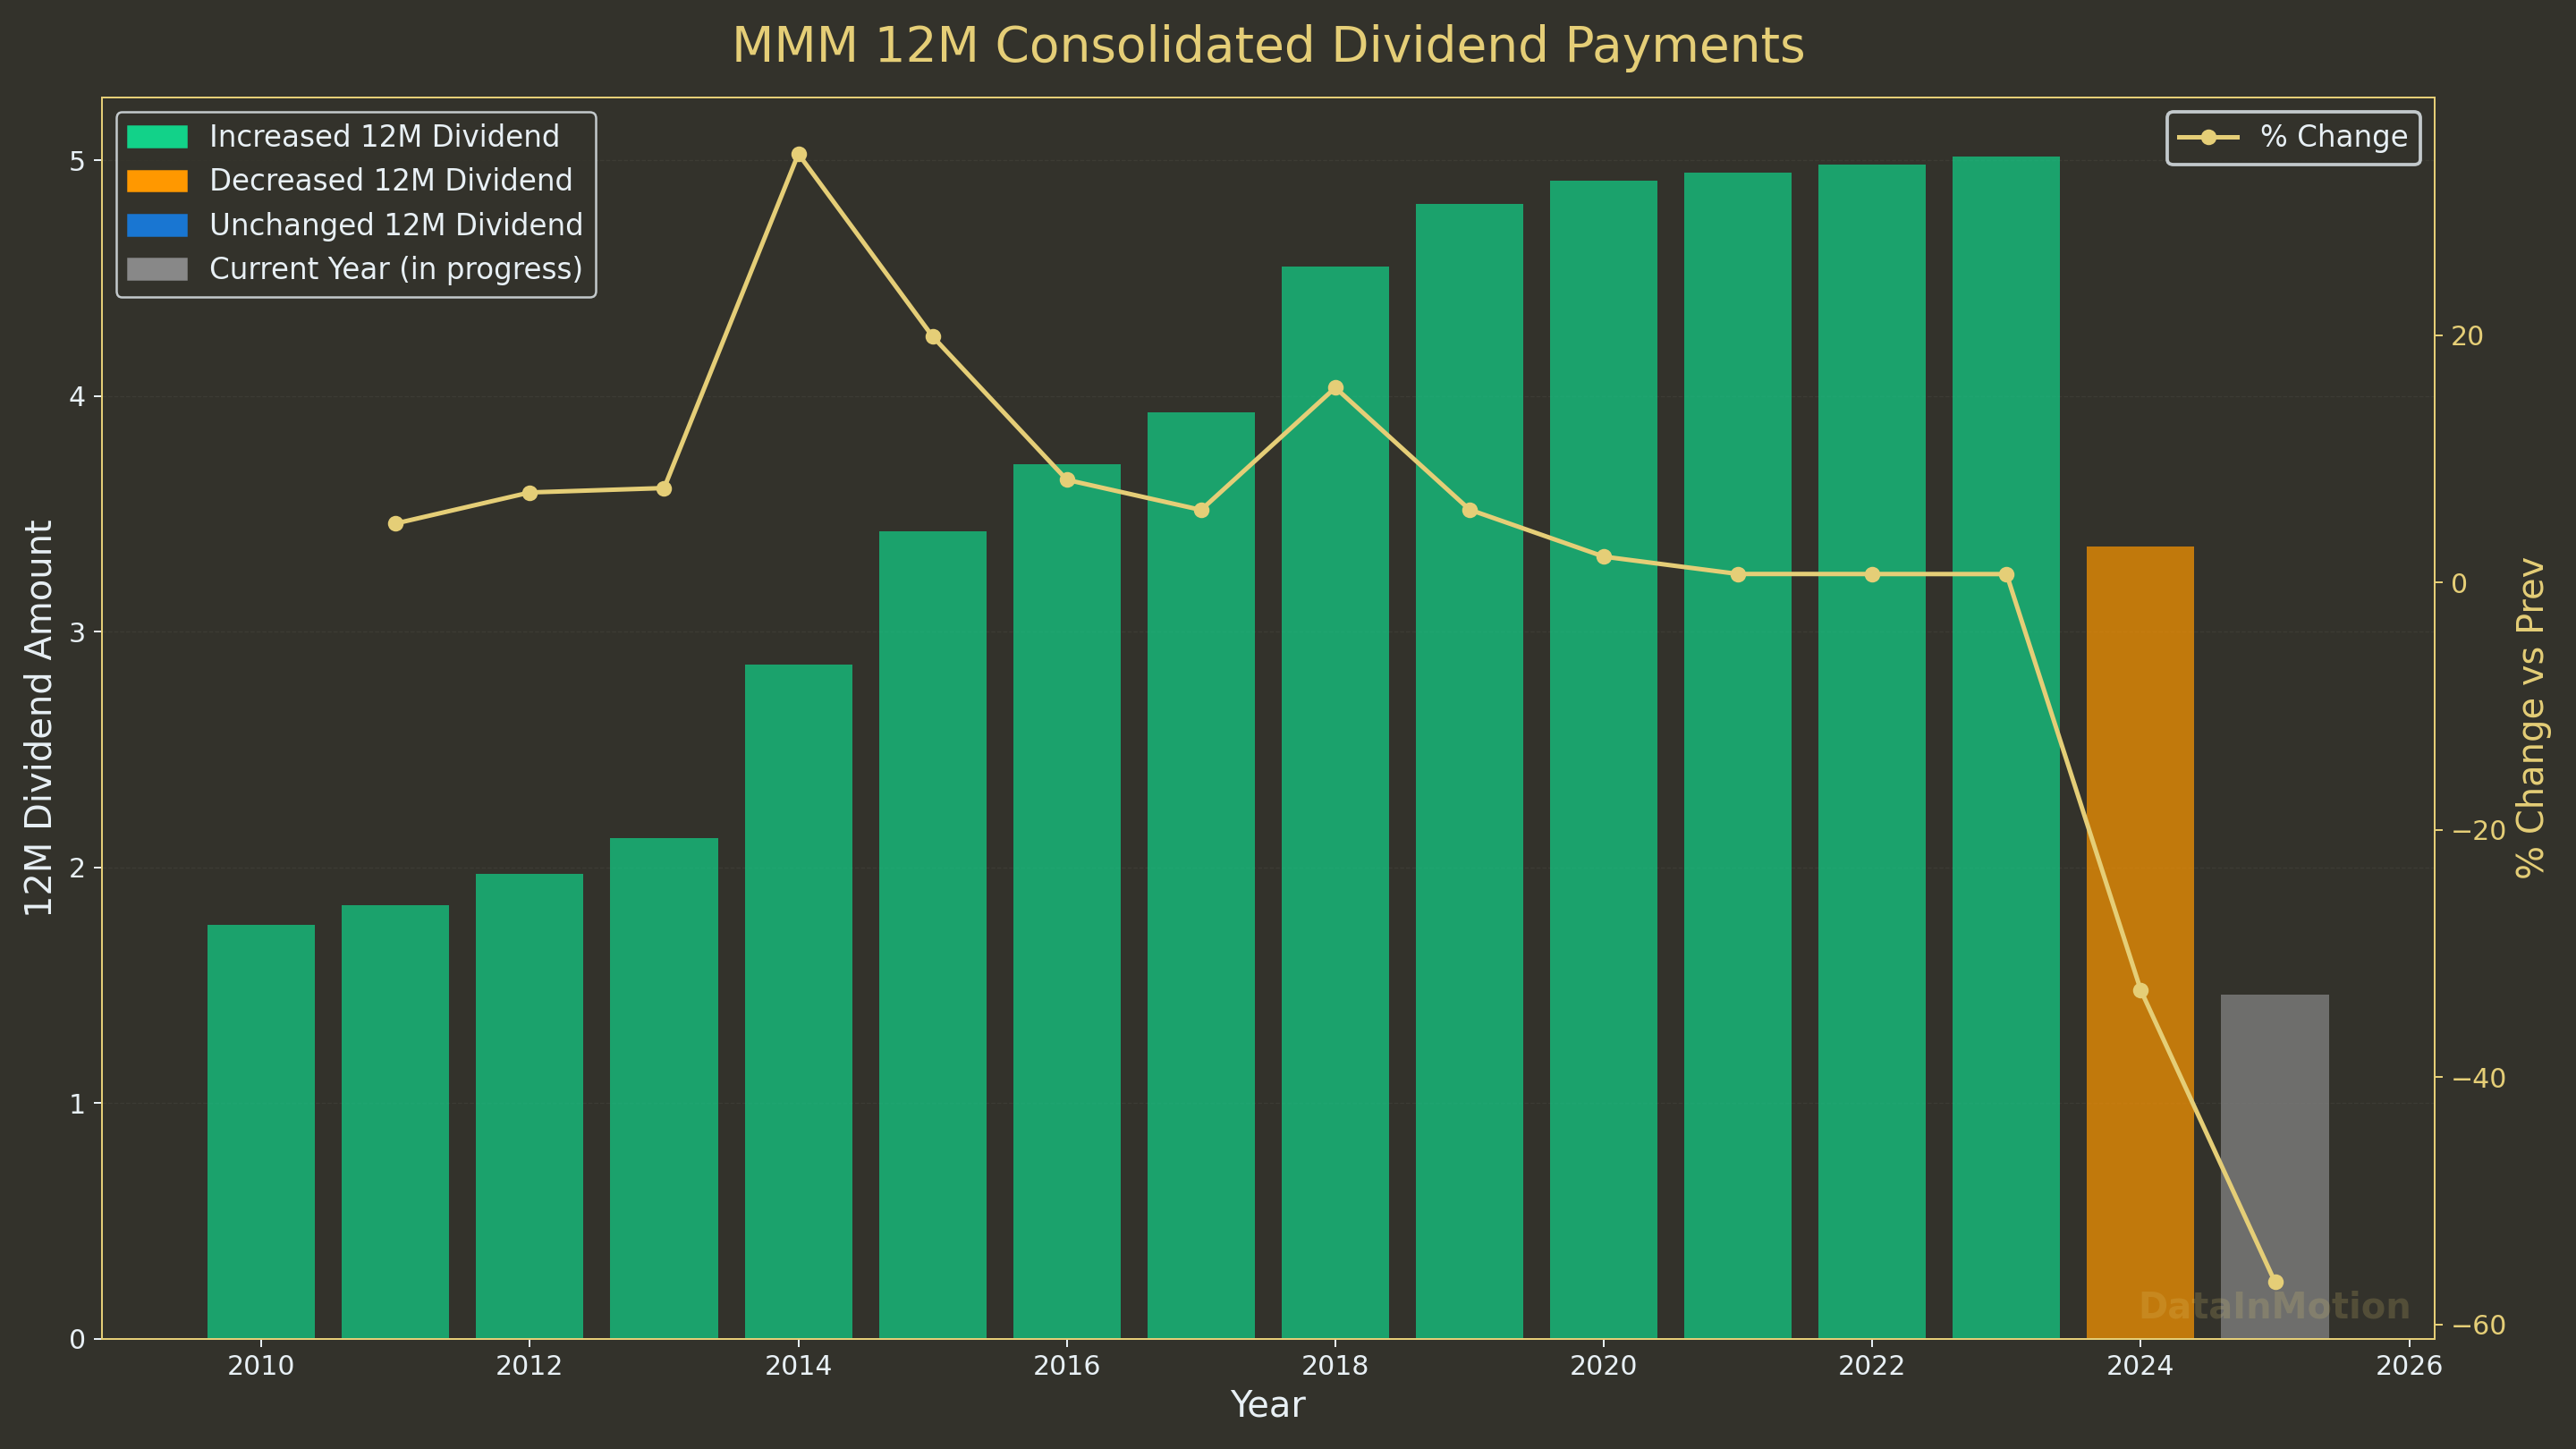
With matplotlib you can do such cool custom graphs: they wont be interactive though
- https://jalcocert.github.io/JAlcocerT/python-financial-data-with-yfinance/#with-dividend-reinvestment
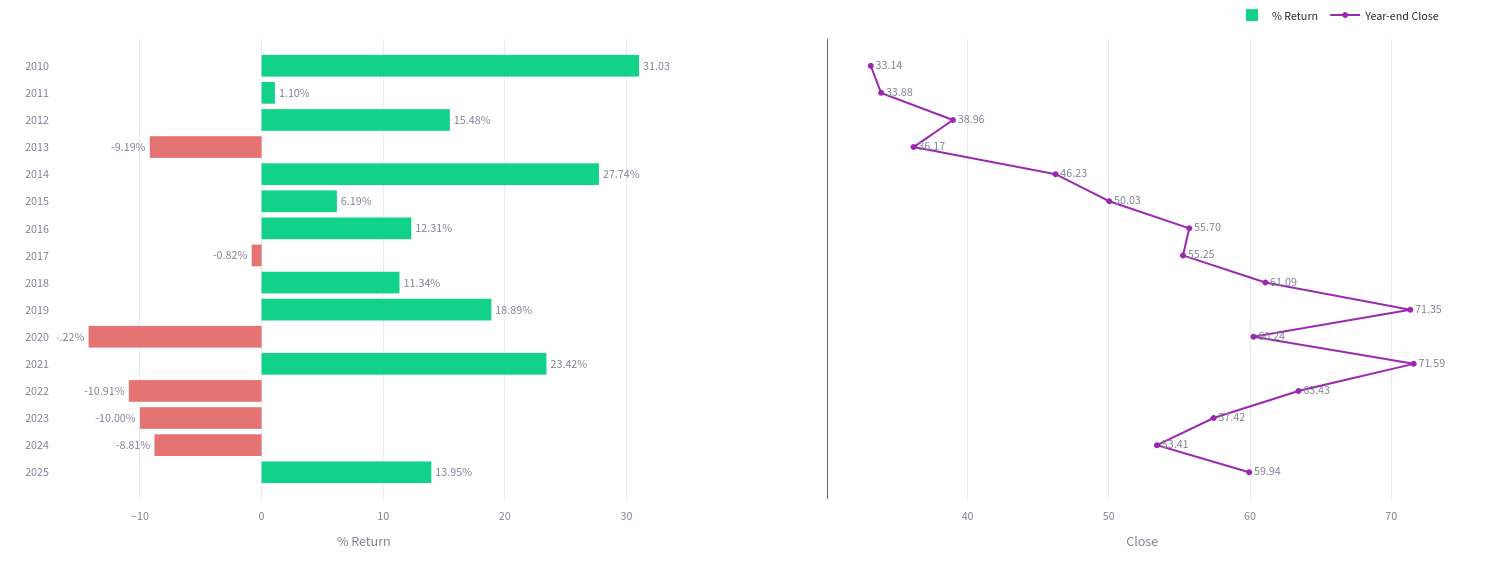
- https://plotly.com/python/horizontal-bar-charts/
Diverging Bar (or Butterfly) Chart and Bar Chart with Line Plot
As mentioned, when a data model is solid, its just a matter to vibe code to get these with one prompt: https://github.com/JAlcocerT/DataInMotion/blob/libreportfolio/streamlit_ath_viewer.py
So all this is just about yfinance x python, as you know.
See how much you can get: From ATH tables, to top/worst analysis, days since last ATH…
uv run streamlit run streamlit_ath_viewer.py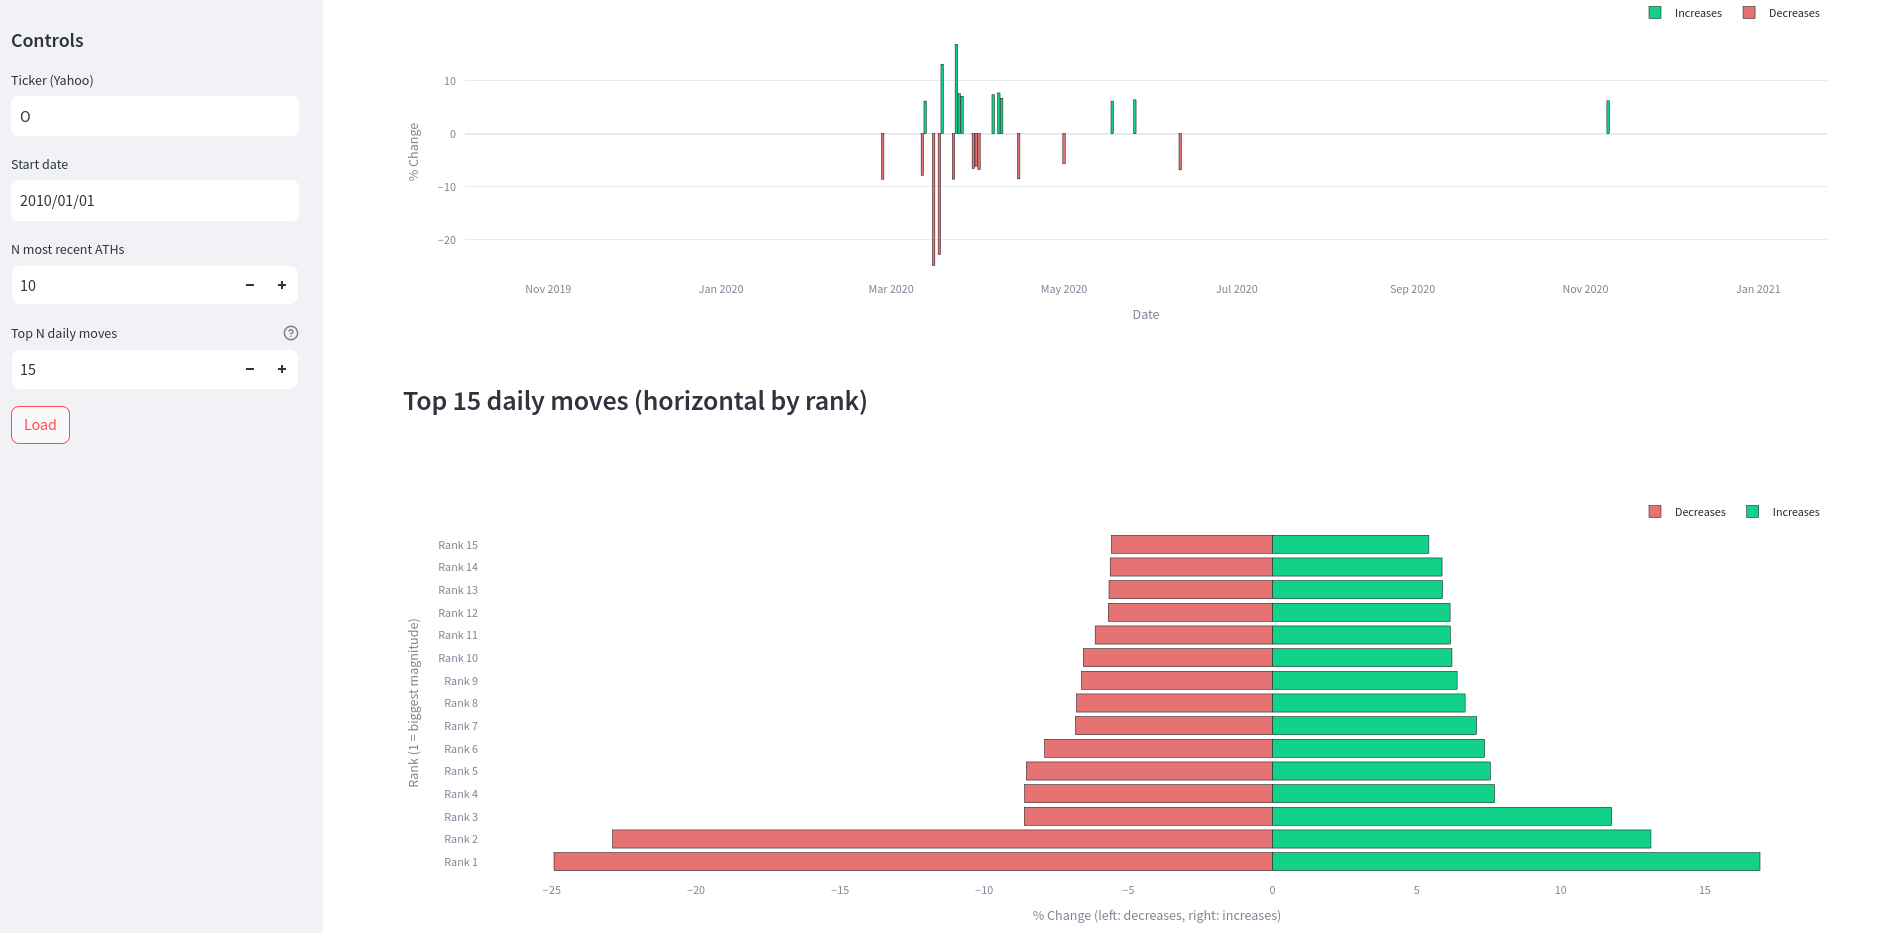
Drafting quick graphs with streamlit around yfinance data:
The good thing with yfinance is that it also pulls crypto data, like BTC-USD or ETF like IDUS.L
So if the topic is trendy…you can create that cool Python analysis btc cycles - max to valley with matplotlib and get your doubts solved.
Or just create a quick flask webapp so that anyone can download such cool plots: graficas.libreportfolio.fyi
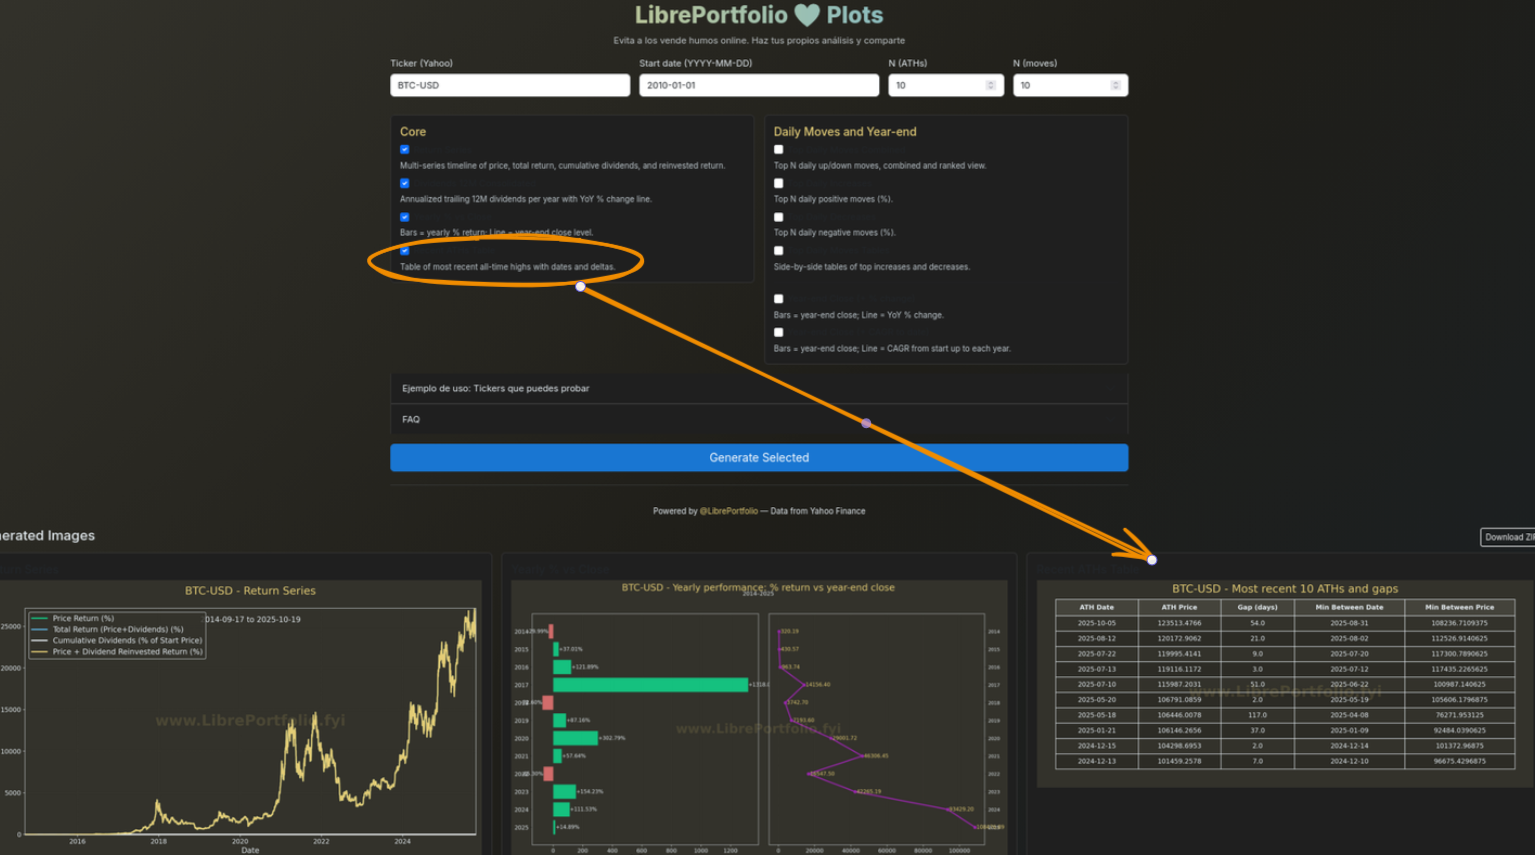
If you have vibe coded properly, this is as simple as: data preparation scripts -> scripts for plots -> webapp
Interesting Books
- The little book of valuations
- The Millionaire Fast Line
graph LR
    %% Main Flow
    A[Business System
Focus] -- "5x Life Expenses" --> B{Allocation Hub}

    %% Distribution Branches
    B -- "x2.5 (50%)" --> C["Keep & Grow Wealth
(Diversify)"]
    B -- "x1.5 (30%)" --> D[Tax]
    B -- "x1.0 (20%)" --> E[Lifestyle]

    %% Styling
    style A fill:#f9f,stroke:#333,stroke-width:2px
    style B fill:#fff,stroke:#333,stroke-dasharray: 5 5
    style C fill:#d4edda,stroke:#28a745,stroke-width:2px
    style D fill:#f8d7da,stroke:#dc3545,stroke-width:1px
    style E fill:#fff3cd,stroke:#ffc107,stroke-width:1px
Is ~70% (2,5/3,5) of savings aka future, not fundamental nor fun expenses, a lot?
- https://www.reddit.com/r/investing/wiki/readinglist/
- Boglehead guide
- A random walk down Wall Street
FAQ
How to define the scope of a Project:
- BRD: The high-level business “why” and “what.”
- PRD: The detailed product “what.”
- FRD: The technical “how.”
FRD vs User Stories 📌
You’ve hit on a key point of the shift from traditional to Agile methodologies.
Yes, in many Agile frameworks, particularly Scrum, user stories often replace the detailed Functional Requirements Document (FRD).
The Problem with the FRD in Agile
- Fixed and Detailed: The FRD is a static document that assumes all requirements can be known upfront. In Agile, the philosophy is that requirements will emerge and change over time.
- Discourages Conversation: A comprehensive FRD can lead to a “sign it and build it” mentality, where developers simply follow instructions. Agile values collaboration and communication, and a rigid document can be a barrier to that.
- Focuses on “What the System Does”: While the FRD is a great tool for technical teams, it can lose sight of the “why.” It describes system behavior (“The system shall validate the user’s credentials”) without tying it to the user’s need.
How User Stories Change the Approach
User stories shift the focus from a detailed technical specification to a high-level, user-centric description. A user story is a promise for a conversation, not a final document.
The classic format of a user story is:
As a
<type of user>, I want to<perform some action>, so that<I can achieve some goal/benefit>.
Instead of a 50-page FRD, an Agile team uses a backlog of user stories to define the work.
The Key Elements that Replace the FRD’s Detail
The detailed information that would have been in an FRD doesn’t disappear; it’s just captured differently and at a different time.
Conversation: The user story’s primary purpose is to spark a conversation between the product owner, developers, and designers. This conversation happens during sprint planning and backlog refinement, where the team discusses the “how” in detail.
Acceptance Criteria: Each user story has a set of Acceptance Criteria. These are specific conditions that must be met for the story to be considered “done.” They serve the same purpose as the FRD’s requirements—they define testable system behaviors. For example:
- User Story: “As a user, I want to be able to log in so that I can access my account.”
- Acceptance Criteria:
- GIVEN a user provides a valid email and password, WHEN they click “Log In,” THEN they are redirected to their dashboard.
- GIVEN a user provides an invalid password, WHEN they click “Log In,” THEN an error message “Invalid credentials” is displayed.
Refinement and Just-in-Time Documentation: The team doesn’t define all the technical details upfront. They are elaborated on as the story moves to the top of the backlog, right before it’s pulled into a sprint. This is often called “just-in-time” documentation.
This avoids building out detailed plans for features that may change or be de-prioritized.
In essence, user stories bring the conversation and collaboration to the forefront, allowing teams to be more flexible and responsive to change—which is the core of the Agile Manifesto.
YFinance Overpowered
Contunuing from the EDA on stonks.
Come on, how cant be possible to get Historical EPS -> PER and Payouts Ratios (div/eps) just with yfinance data?
And get something like: https://www.macrotrends.net/stocks/charts/CL/colgate-palmolive/pe-ratio
All thanks to the ticker.info and Ticker.income_stmt.
$NVDA NVIDIA Q2 FY26 (July quarter).
— App Economy Insights (@EconomyApp) August 27, 2025
• Revenue +56% Y/Y to $46.7B ($0.6B beat).
• Operating margin 61% (-1pp Y/Y).
• Non-GAAP EPS $1.05 ($0.04 beat).
Q3 FY26 guidance:
• Revenue $54.0B ($1.2B beat) (w/o H20 to China). pic.twitter.com/Ipih9p1dMY
See more at this subfolder of the yfinance EDA exploration
import yfinance as yf

ticker = yf.Ticker("MUV2.DE")
info = ticker.info

trailing_pe = info.get("trailingPE", None)
forward_pe = info.get("forwardPE", None)

print(f"Munich Re P/E ratios:")
print(f"Trailing P/E: {trailing_pe} (based on actual earnings over the past 12 months)")
print(f"Forward P/E: {forward_pe} (based on projected earnings over the next 12 months)")

print("\nExplanation:")
print("- The trailing P/E uses the company's historical earnings, providing a reliable snapshot based on actual past performance.")
print("- The forward P/E uses projected future earnings estimates, offering insight into expected growth but subject to forecast uncertainty.")
From the information available about yfinance:
For net profit margin: yfinance itself does not provide a direct ready-made field for net profit margin. However, net profit margin can be calculated manually by using net income and total revenue figures, which can be obtained from yfinance financial statements (income statement). The formula is Net Profit Margin = (Net Income / Total Revenue) * 100%. Users would need to extract these figures from yfinance’s income statement data for the company and then compute the ratio externally.[1][2]
For historical currency rates: yfinance supports downloading historical forex (currency) price data using ticker symbols for currency pairs. For example, EURUSD=X is a ticker you can query on yfinance to get historical EUR/USD exchange rates, including daily open, high, low, close prices.[3][4]
For historical inflation data: yfinance itself does not appear to provide direct historical CPI or inflation rate data as a standard ticker. However, there exist inflation indexes such as IQ CPI Inflation Tracker Index (^IQHGCPI) available on Yahoo Finance, which may be accessible through yfinance for inflation tracking. For detailed inflation data, one might need to use other dedicated economic data sources.[5]
In summary, yfinance can provide the components to calculate net profit margin but not the margin directly, can fetch historical currency exchange rates via forex ticker symbols, and may provide some inflation index tickers but generally not detailed historical inflation rates directly.
It is generally not straightforward to get a long historical series of net profit margins directly from yfinance since yfinance provides only up to about 4 years or 4 quarters of financial statements data (income statement, balance sheet, cash flow). The financials accessible generally show the most recent reported periods.
You can, however, retrieve past annual or quarterly income statements within that limited historical window from yfinance, extract total revenue and net income for each period, and calculate net profit margin manually for those periods.
For longer historical financials data beyond that timeframe, yfinance does not provide it natively. Users often need to rely on more specialized financial databases or services (sometimes paid) or manually collect historical data from annual reports and filings.
In summary:
- yfinance supports retrieval of recent historical income statements (quarterly/annual) up to about 4 years or 4 quarters.
- You can parse this data to calculate net profit margins over those recent periods.
- Long-term historical net profit margin series would require alternative financial data sources outside yfinance.[1][2][3]
How to Start PyStonks Project
Step 1:
Get familiar with git: https://it-tools.tech/git-memo
In this case Github, but it could have been Gitlab / Gitea similarly:
git init
git branch -m main
git config user.name
git config --global user.name "JAlcocerT"
git config --global user.name
git add .
git commit -m "Initial commit: Pystonks Cerdos project"

#sudo apt install gh
gh auth login
gh repo create py-stonks-cerdos --private --source=. --remote=origin --push
Step 2: stop copy pasting from chatgpt and use Windsurf/Cursor/whatever
Are those 20$/month more valuable than your time? Please…
Tests
Ive been doing some branching to do some tests and try how the data layer can look like.
All from the learnings of the previous post.
Firebase Auth
FastAPI x Firebase Auth worked on desktops perfectly:
- https://github.com/JAlcocerT/py-stonks/blob/main/ui-for-fastapi-firebaseauth.md
- https://github.com/JAlcocerT/py-stonks/blob/main/docker-compose.fastapi-ui.yml
MailerLite some features behind a subscribe wall could also be interesting
Outro
Interesting concepts:
- The compound Interest threshold
Motivational Examples
https://www.dividendcompass.comhttps://divstash.app/
People are doing
Interesting cross platform service: https://divstash.app/
I got to know at https://www.reddit.com/r/dividends/comments/1mtpot7/finally_hit_1000_a_year_in_dividends/ and publishing their achievements with cool graphs
With CSR driven Calculate Your Dividend Potential section :)
Its also nice to see when the snowball effect starts to be noticed: like how much % of what you invest, comes already from dividends reinvested /monetary system feedback.
And has an interesting on boarding flow: https://divstash.app/signup/step-1 and T&Cs are mandatory: https://divstash.app/signup/quick
And by the time of RStocks, I had in mind as reference the stock events app: https://stockevents.app/en?pt=118220498&ct=&mt=8
¿Qué os parece esta idea? Información básica de un vistazo 🤔 pic.twitter.com/XFWOsIsL2t
— Dividiendolo (@dividiendolo) October 16, 2025
Selfhostable Apps
The personal finance app for everyone
Firefly III: a personal finances manager
MIT | A local-first personal finance app
agpl 3.0 | OpenStock is an open-source alternative to expensive market platforms. Track real-time prices, set personalized alerts, and explore detailed company insights — built openly, for everyone, forever free.
Interesting Software for Finances
Open Source Finances",“FireFly3
Financial Freedom is an open-source financial management tool.
- https://github.com/serversideup/financial-freedom
- It serves as an alternative to commercial apps like Mint and YNAB.
GPL3.0 | An open source alternative to Mint, YNAB, and more. Stay on budget and build wealth without sacrificing your privacy.
More about Financial Freedom Software 📌
This project addresses privacy concerns by allowing users to self-host their financial data.
Users can run the application on any device with Docker support, enhancing control over their financial information.
Key features:
- Supports any bank: Integrate with various banking institutions.
- Private synchronization: Ensures data privacy during synchronization.
- Self-hosting: Run on AWS, Digital Ocean, or even Raspberry Pi.
- Budgeting tools: Helps in managing cash flow and setting budgets.
- Global currency support: Manages finances in multiple currencies.
The project is actively being developed, inviting community involvement through contributions.
Financial Freedomempowers users to manage finances privately and securely.
Similar projects include Firefly III and GnuCash.
Simple Budgeting, Powerful Results
Selfhostable Personal Finance Tools
Whether TradFi, DeFi, or whatever it comes, you might want to bring clarity to your personal finances.
But before building PyStocks v2, see what others have created.
Ghostfolio
Ghostfolio has a lot of features:
Ghostfolio can be installed via docker and also via UmbrelOS:
- http://192.168.1.2:86/app-store/ghostfolio
- http://192.168.1.2:3334/en/resources/guides
Pre-Requisites! Just Get Docker and setup Ghostfolio 🐋
Important step and quite recommended for any SelfHosting Project - Get Docker Installed
It will be one command, this one, if you are in Linux:
apt-get update && sudo apt-get upgrade && curl -fsSL https://get.docker.com -o get-docker.sh
sh get-docker.sh && docker version
echo -e "POSTGRES_PASSWORD=$(openssl rand -base64 32)\nACCESS_TOKEN_SALT=$(openssl rand -base64 32)\nJWT_SECRET_KEY=$(openssl rand -base64 32)" > .envThanks to https://mariushosting.com/how-to-install-ghostfolio-on-your-synology-nas/
Paisa
Actual Budget
A local-first personal finance app
firefly-iii
- https://github.com/firefly-iii/firefly-iii/
- https://mariushosting.com/how-to-install-firefly-iii-on-your-synology-nas/
Maybe
The OS for your personal finances
FAQ
Other F/OSS Apps for Finance Management
Free and Open Source Alternative to Splitwise. Share expenses with your friends and family.
Very interesting for group trips
AGPL 3.0 | Budget5S aims to offer a free alternative to budget managers.
- https://github.com/ellite/Wallos - Wallos: Open-Source Personal Subscription Tracker
Wallos is a powerful, open-source, and self-hostable web application designed to empower you in managing your finances with ease.
MDD
Maximum Drawdown (MDD) effectively shows the worst-case scenario for an investor who buys at the peak of an asset or portfolio.
It quantifies the largest possible percentage loss they would experience if they bought at the highest point and held through the subsequent decline to the lowest trough before any recovery.
In other words, MDD measures the deepest drop from peak to trough, illustrating the maximum downside risk and potential loss an investor could face if entering at the top of the market cycle.
git clone https://github.com/JAlcocerT/DataInMotion
git checkout libreportfolio
#uv run tests/plot_mdd.py PG --start 2010-01-01 --brand "@LibrePortfolio"
uv run tests/plot_historical_yield_percentiles.py PG --start 2005-01-01 --brand "@LibrePortfolio" --low 10 --high 90 --warmup-days 400
me refiero a esto: pic.twitter.com/zPtdWLsAQr
— Liberty Dividend (@LibertyDividend) October 29, 2025
Maximum Drawdown (MDD) is calculated as the greatest percentage drop in the value of an investment or portfolio from its peak (highest value) to its trough (lowest value) before a new peak is reached.
It measures the maximum loss an investor could have faced in a given period.
MDD Calculation Formula:
$$ \text{MDD} = \frac{\text{Trough Value} - \text{Peak Value}}{\text{Peak Value}} \times 100% $$
Where:
- Peak Value (P) = highest value of the portfolio or asset before the biggest drop
- Trough Value (L) = lowest value of the portfolio or asset after the peak, before a new peak is reached
Steps to Calculate MDD:
- Identify the highest peak value of the asset or portfolio over a given period.
- Identify the lowest trough value that follows this peak.
- Calculate the percentage decline from the peak to the trough using the formula above.
If a portfolio peaked at $100 and then dropped to $70, the MDD is:
$$ \frac{70 - 100}{100} \times 100 = -30% $$
This means the portfolio experienced a 30% maximum drawdown at its worst point.
MDD helps investors understand downside risk by quantifying the largest drop from a previous high.