Financial Data for Python - The YFinance Package
Intro
Financial Data to play with Python Apps via YFinance

Financial Data with Python
How to pull data from: https://finance.yahoo.com/
Yahoo Financials
We just need Python and the package:
MIT | A powerful financial data module used for pulling data from Yahoo Finance. This module can pull fundamental and technical data for stocks, indexes, currencies, cryptos, ETFs, Mutual Funds, U.S. Treasuries, and commodity futures.
pip install yahoofinancials==1.20You can get started with a .ipynb jupyter for exploration.
YFinance
It was a fundamental piece for RStocks, and it will be for any financial tricks you want to do with Python.
- https://pypi.org/project/yfinance/
- https://rowzero.io/blog/yfinance
- https://github.com/ranaroussi/yfinance
Apache v2 | Download market data from Yahoo! Finance’s API
pip install yfinance==0.2.52You can get a ton of information about some stock, like NYSE:KO:
import yfinance as yf
import pandas as pd

def STOCK(ticker):
    return yf.Ticker(ticker).history(period="max")

STOCK('KO')
For prices, you can try with such script
You can also pull dividend data from yfinance, as seen on this example.
import yfinance as yf
import sys

def get_dividend_data(ticker: str):
    """
    Fetch and print the dividend history for a given stock ticker.
    :param ticker: Stock ticker symbol (e.g., 'AAPL')
    """
    stock = yf.Ticker(ticker)
    dividends = stock.dividends
    if dividends.empty:
        print(f"No dividend data found for {ticker}.")
    else:
        print(f"Dividend history for {ticker}:")
print(dividends)- And for currency exchange rates…you can also use yfinance, like so.
Dividend Data - DGI vs Yield
When you put together few stocks with growing dividends, you might expect something like this:
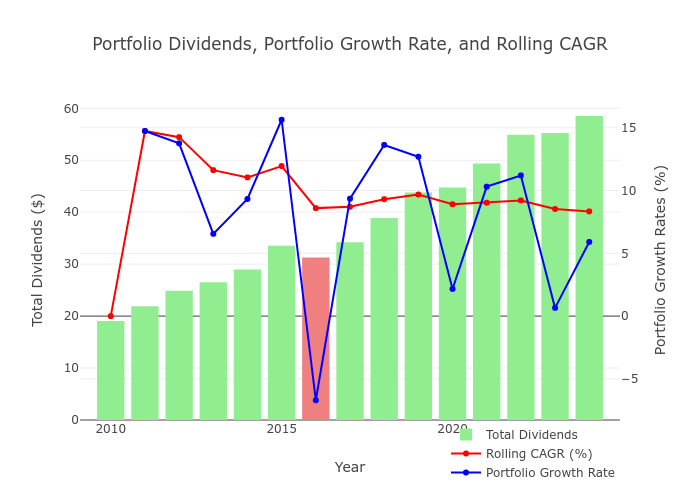
Snapshots generated via PyStocks with Plotly
Some years, the total dividends you are getting from a portfolio, might have a decrease due to:
- Global financial circunstances
- Or maybe just one of the stocks gave you a special dividend last year and now its time to a regression to the mean
What this tries to illustrate its just the general upwards trend.
Specially, if you build a so called dividend aristocrats portfolio.
These are companies with a track record of increasing dividends for many years, even during recessions like in 2008.
To compare it with real estate, rental prices decreased about 20% (dividend) and rental 40% from its peak.
The price of the companies was also reduced at those times, which caused anomaly high initial yield when buying those stocks
But what’s better, high yield or high dividend growth?
Ideally something that give us both, but, there is always a trade off.
And some people call high yield investments as dividend traps.
Are then worth to invest the slow and well known stocks?
What does the data and math tell us about it?
As seen on the real estate post, the catch up its all about: $t = \frac{\ln(A/B)}{\ln(1 + (r))}$
- Where A and B are the initial yield of each stock
- And r the difference in growth between them
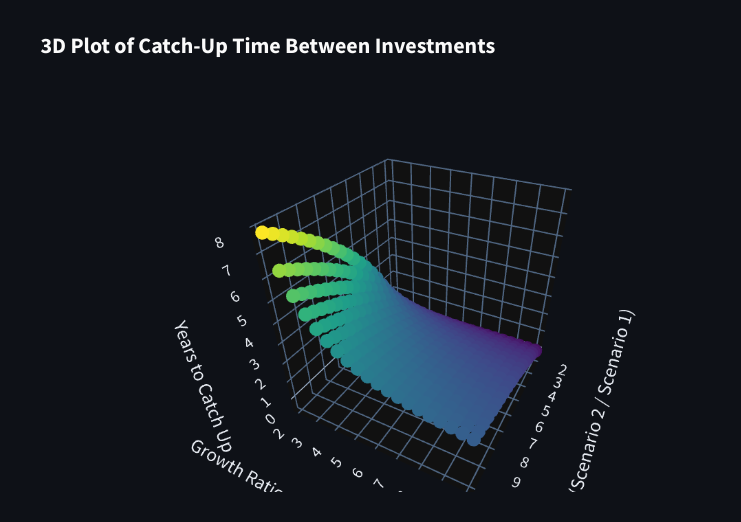
No Dividend Reinvestment
In this case, you just buy one time in the beginning, no debt, sit and wait to see how each of those 2 evolve:
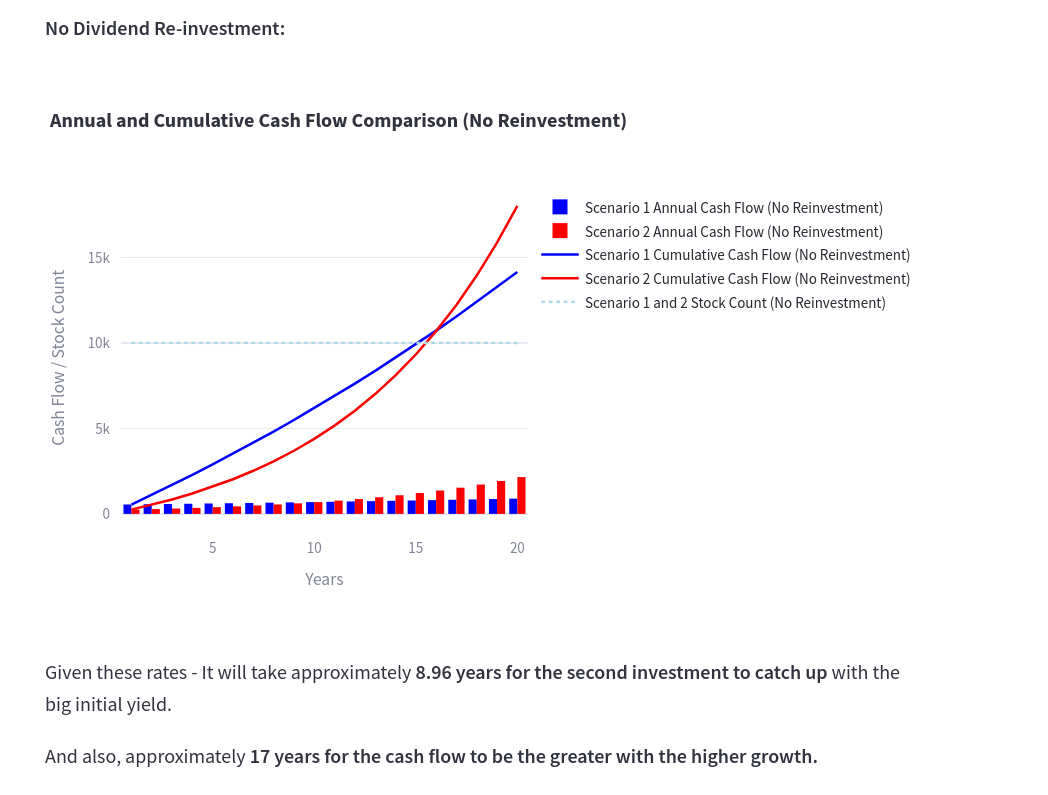
See how long it takes for 2.5% yield growing at 12% to catch up with 5.5% which grows at 2.57%
Powered by this animation script
With Dividend Reinvestment
How about keep buying by re-investing the dividends?
Assuming that the price of the stock and the initial yield is the same, we would get:
With some vibe coding here, I got to see the difference of evolution of SPY in terms of:
To make a simple plot, you can do like so
python plot_total_return_from_yfinance.py PG 2010-01-01- Just Price
- Price + dividends
- Price + dividends reinvested
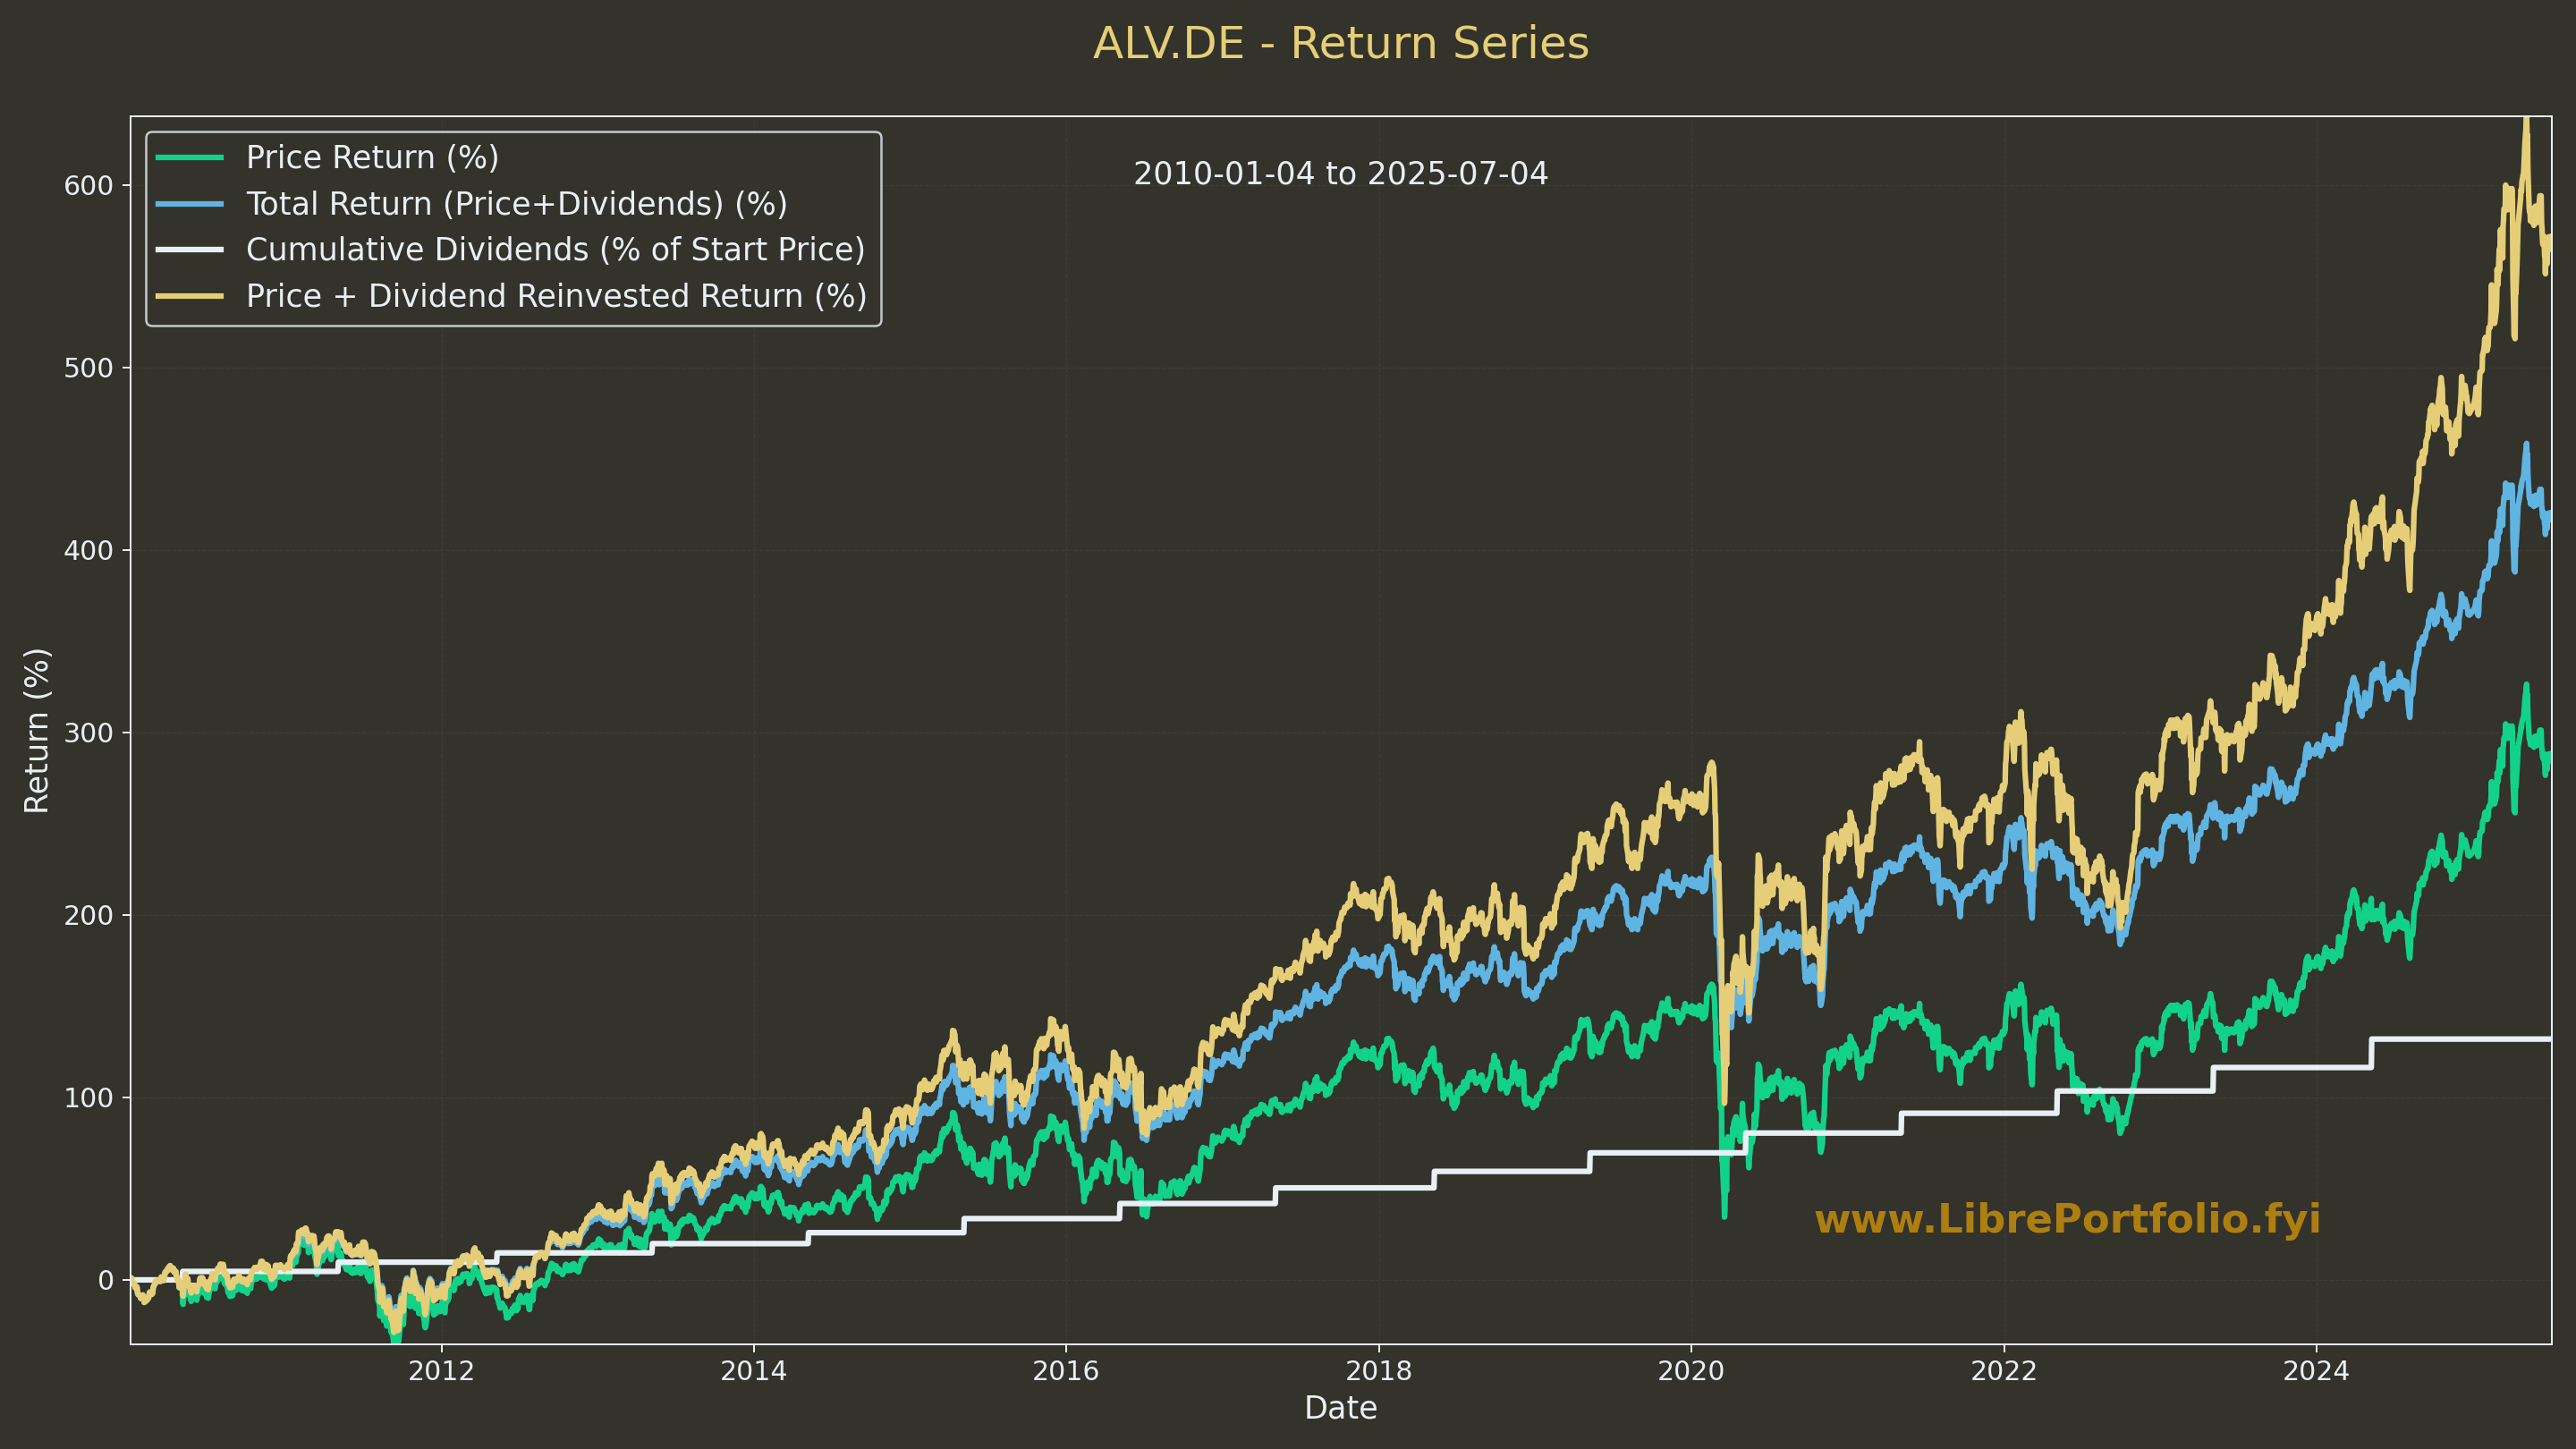
Sample series for
ALV.DEwith this script
Sometimes, some dividend aristocrats will break their strike:
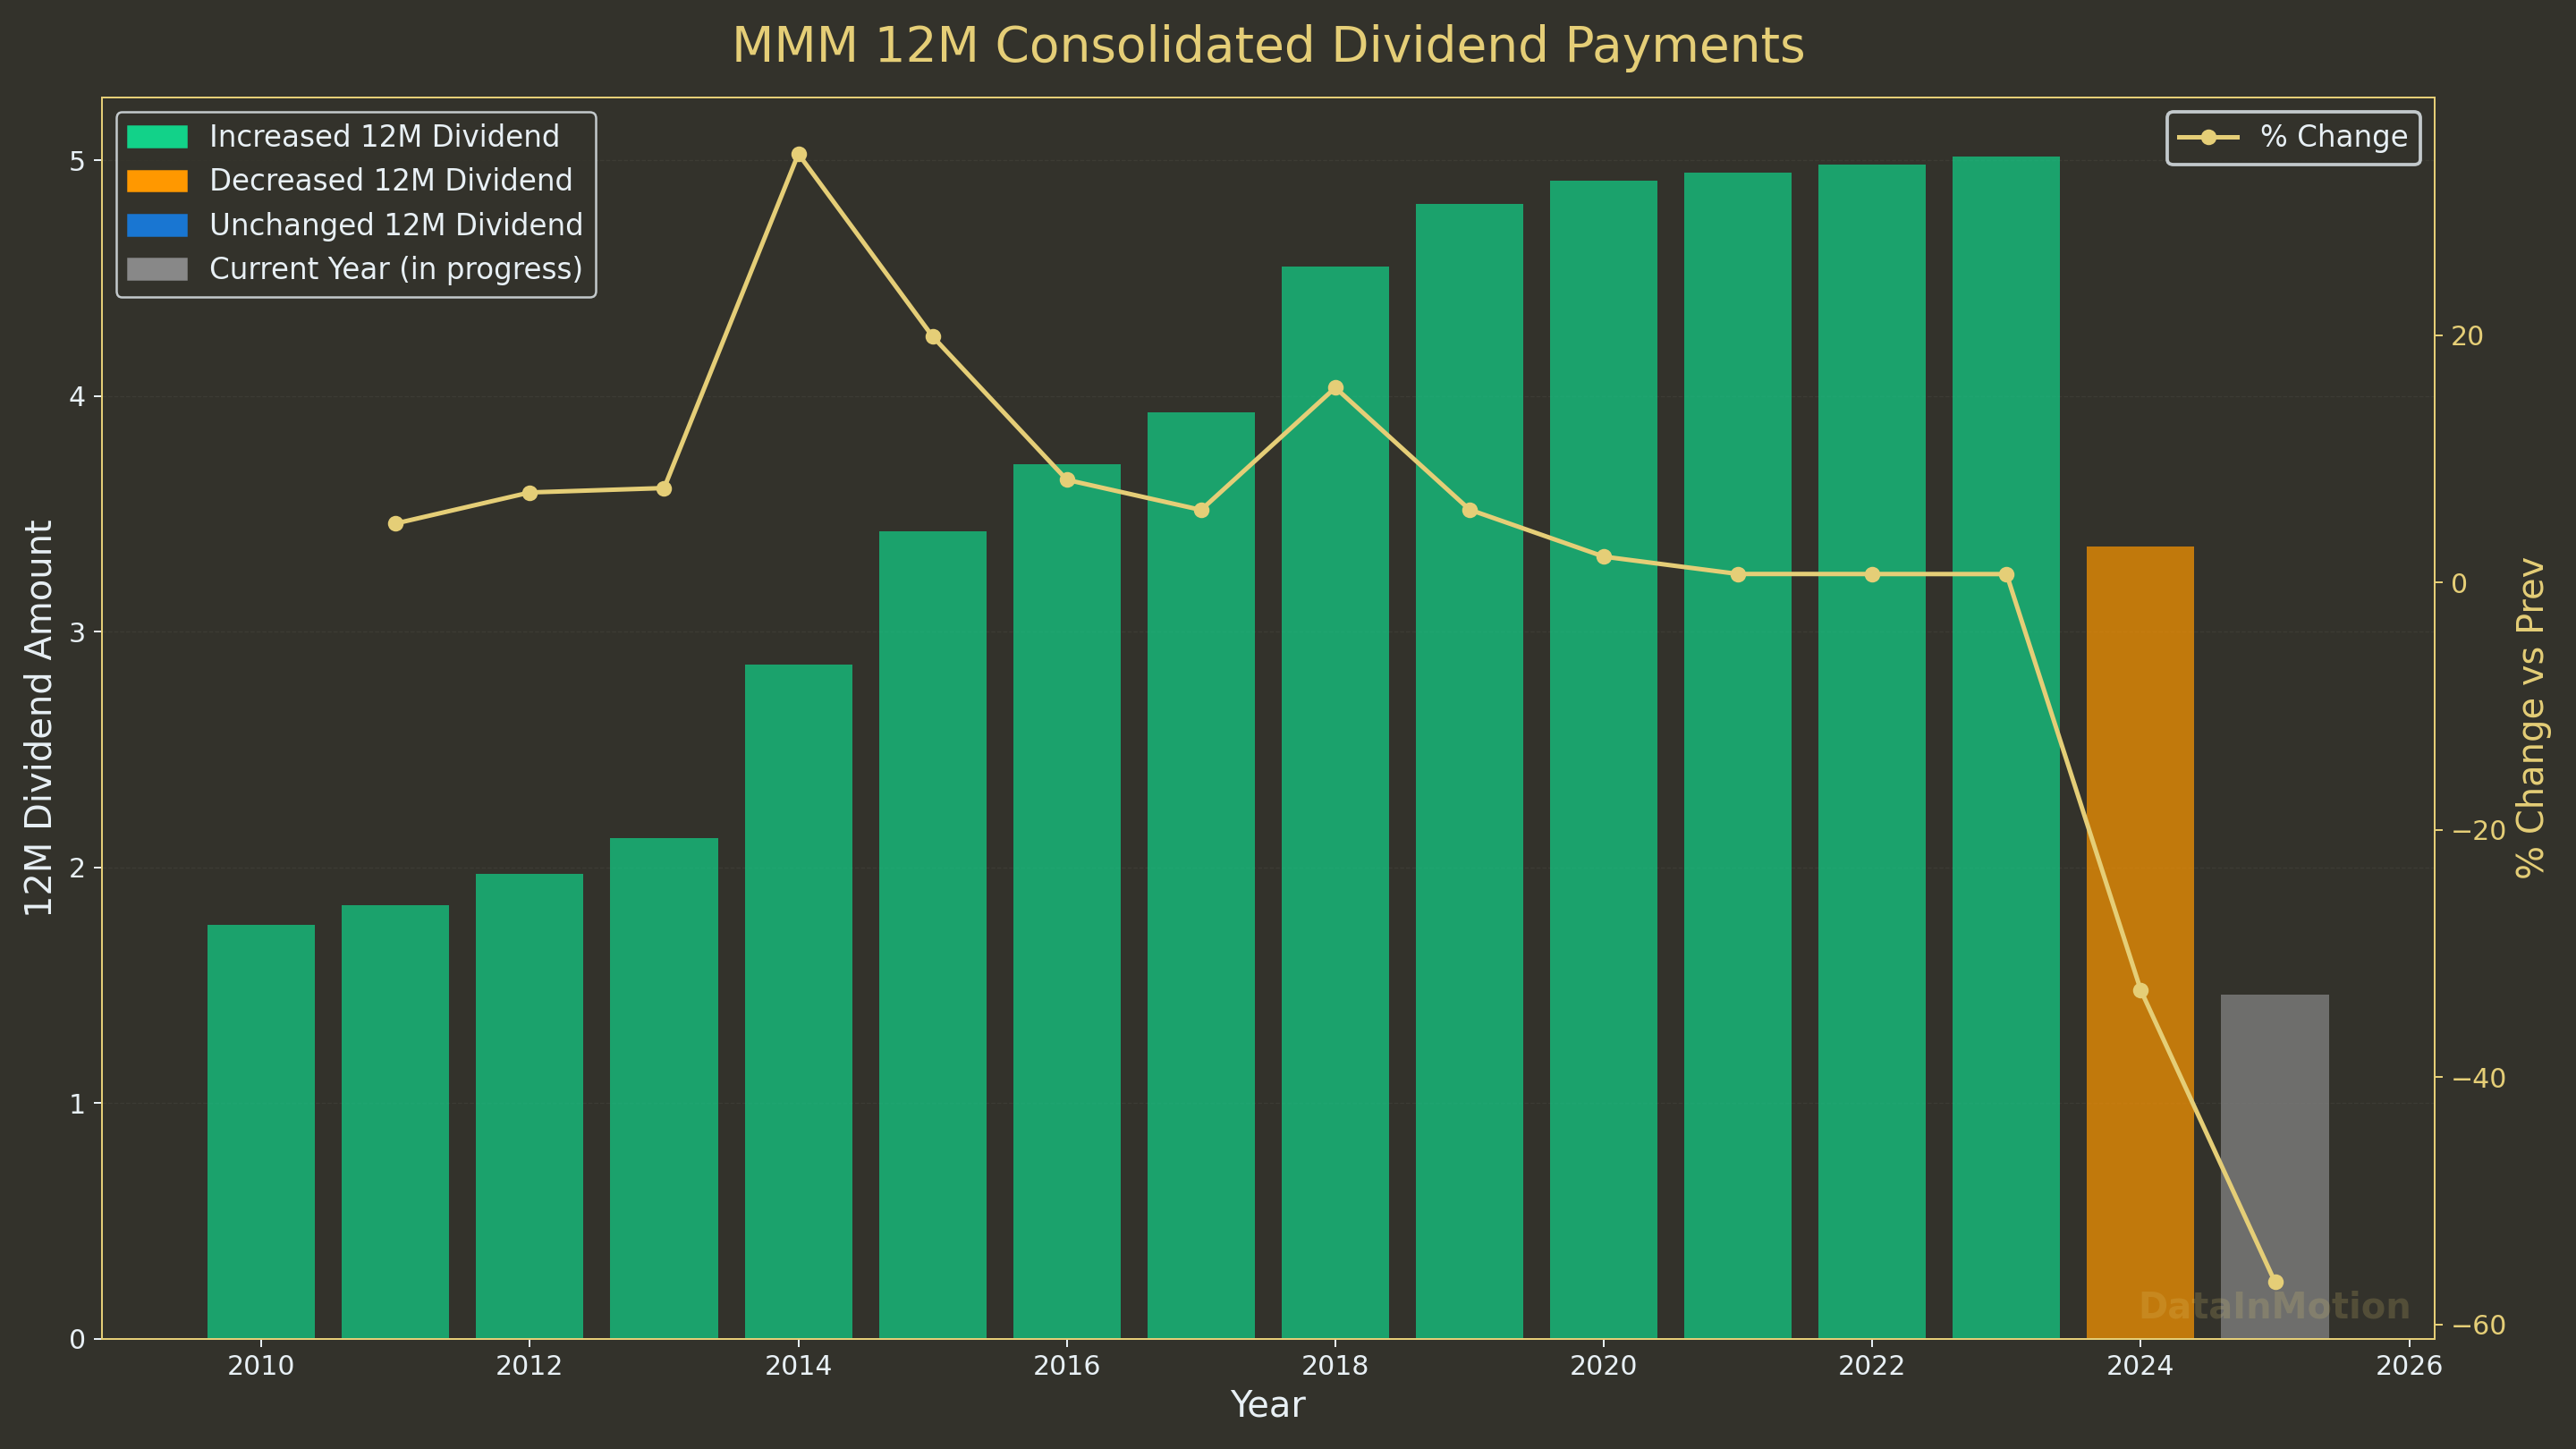
uv run tests/plot_dividends_pct_12m.py MMM 2010-01-01Generated for 3M with this script
Compared with Real Estate
You can always keep improving the charts: like adding the number of % change
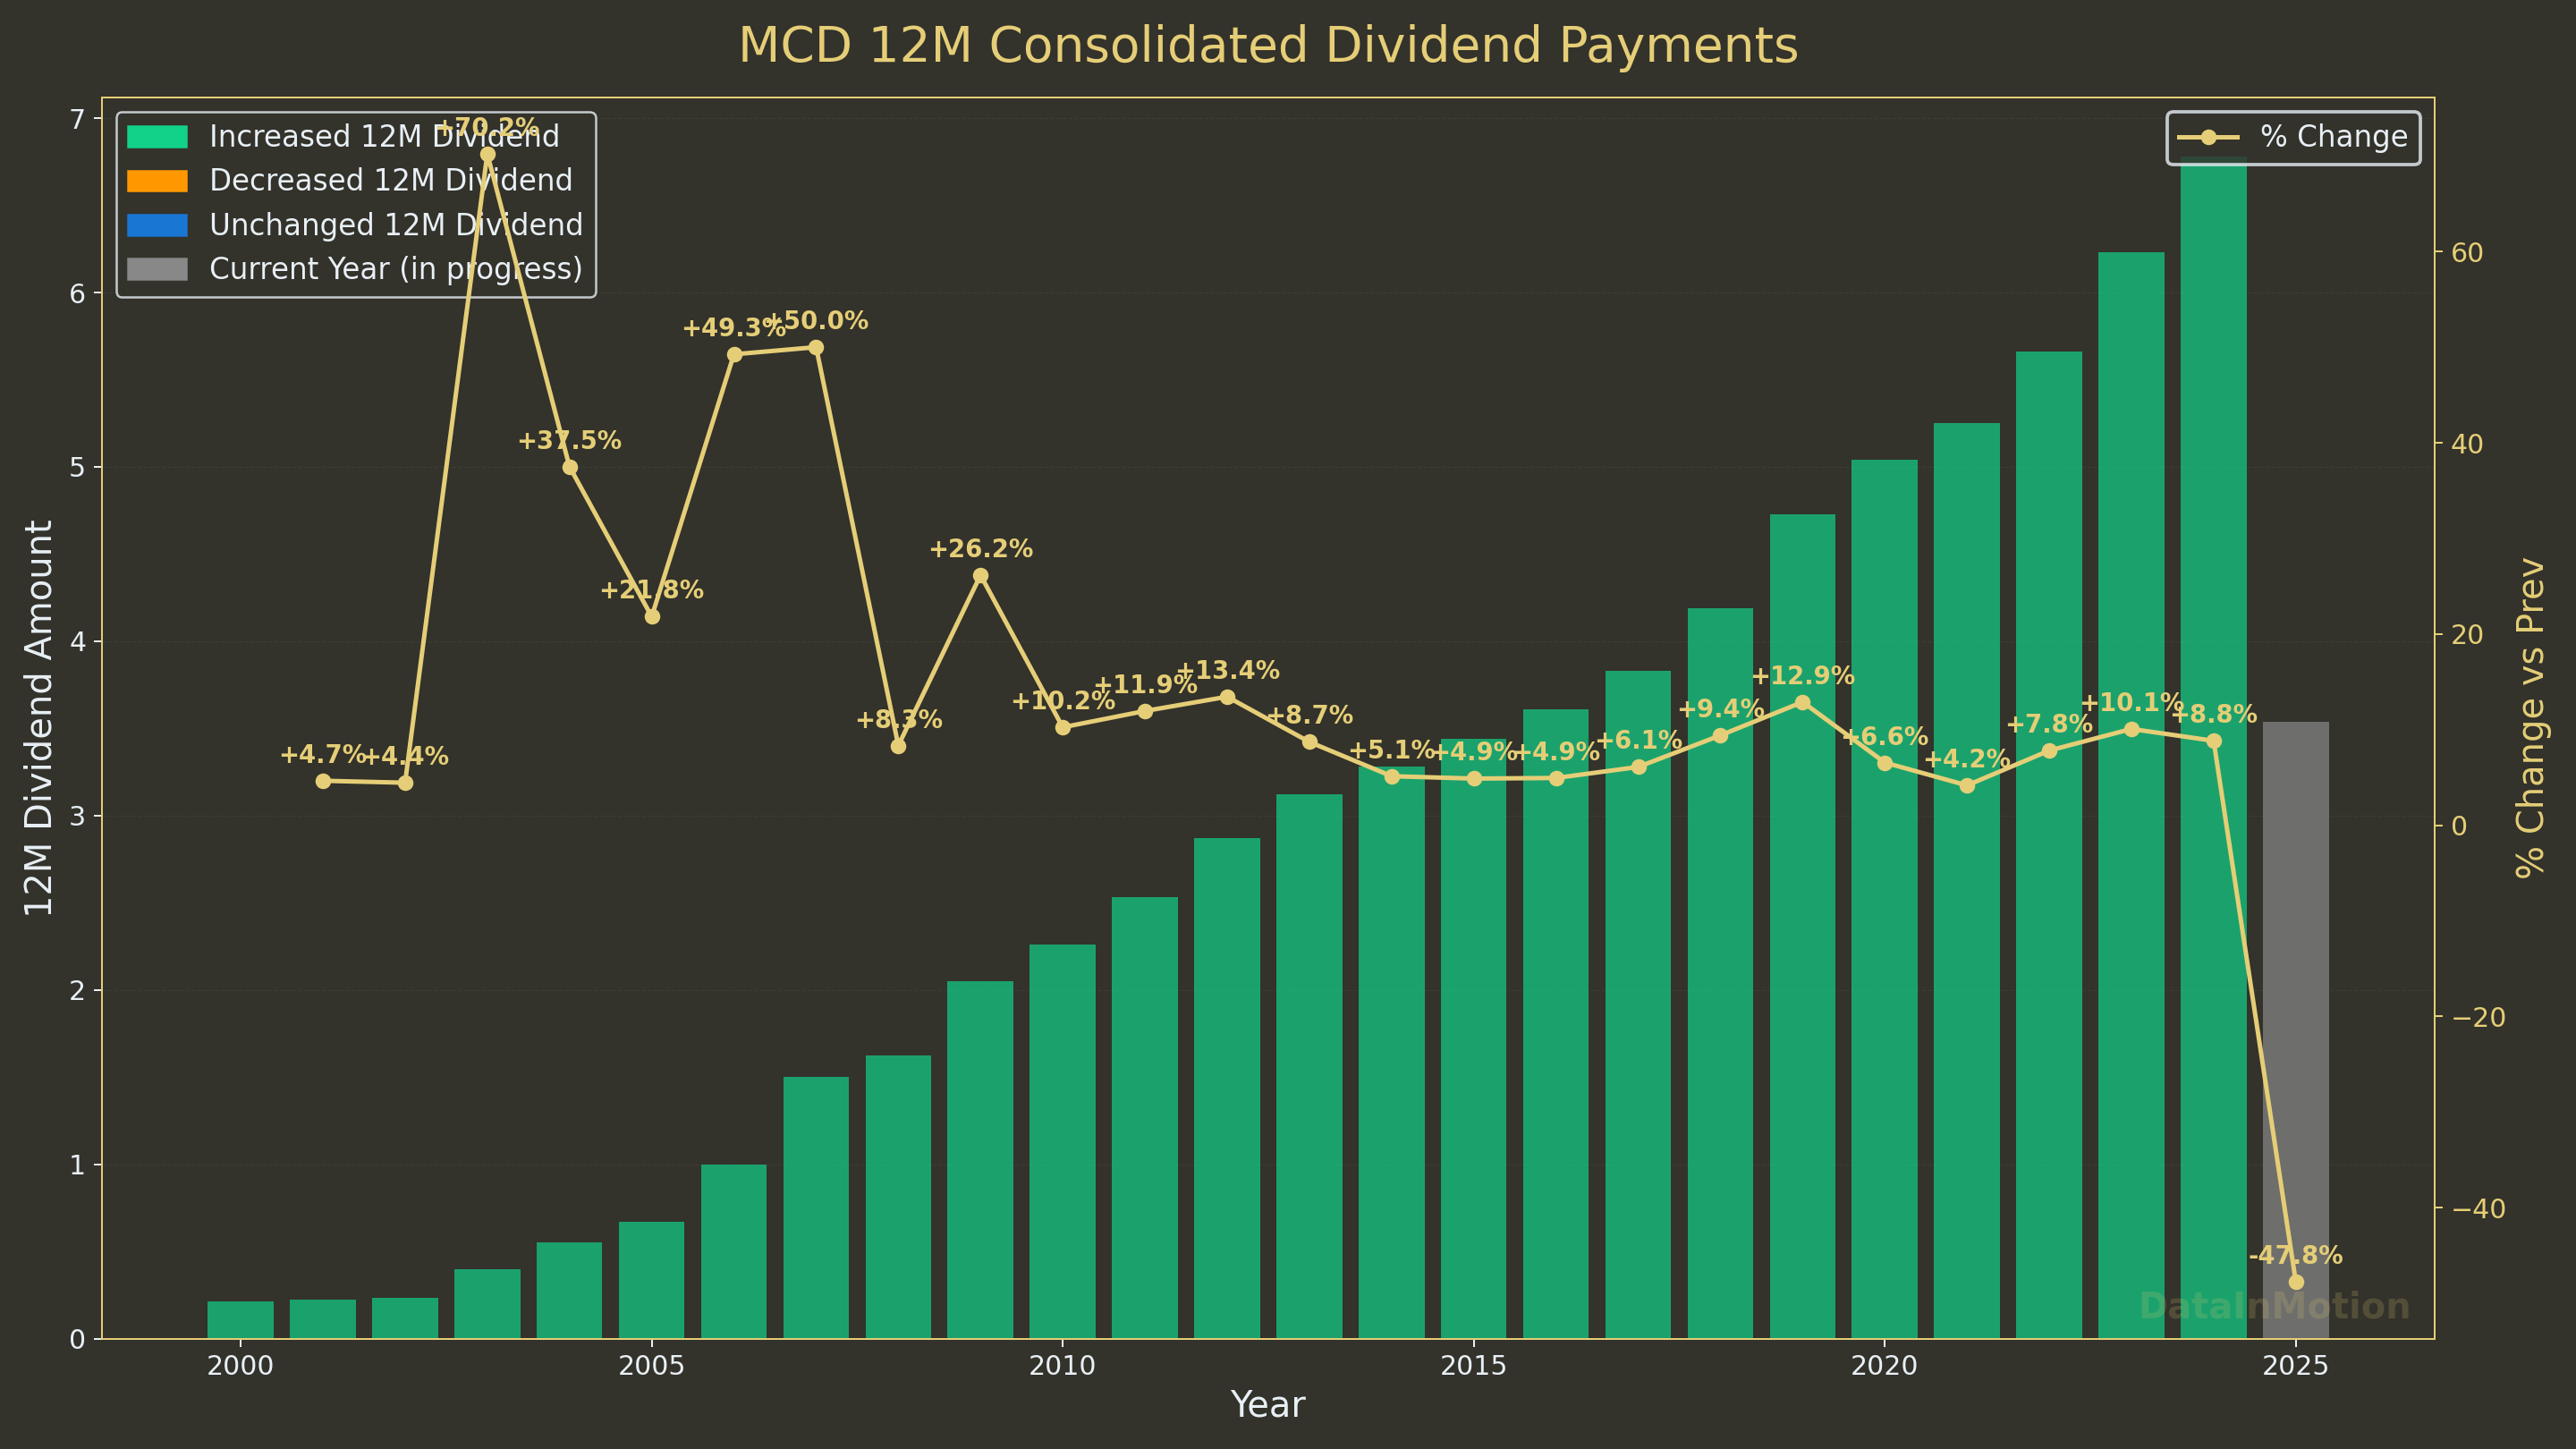
Generated for
MCD, which can give you insights about how real estate can do
Will that growth be repeated? who knows! The thing is that you can do cool graphs with Matplotlib…
=== Dividend Growth Statistics ===
Range considered: 2000–2024
Total % increase: +3053.5%
CAGR (all completed years): +15.46%
5y CAGR: +7.47%
3y CAGR: +8.90%
=================================
And you can create such animations:
Stock Value Data
That was how dividends can (or not) behave over time.
How about the stock value?
Wait, If you are getting tempted to use ML to get rich…remember about Overfitting the data
The model complexity myth comes to rescue: http://jakevdp.github.io/blog/2015/07/06/model-complexity-myth/
Which can be also told as: previous performance does not guarantee ANYTHING for future performance
But, you can anyways do your data experiment for fun:
Conclusions
People throw many numbers into finance.
Like: “Sp500 is 10% avg return.”
Did it?
It depends when exactly you are looking at.
Now you can play with the data and see for yourself
Probably is more important than ever to check all that info that is being thrown at us on social media
Some say that you should go with the 65/20/15 (Living expenses/fund spending/future you) approach.
Or the 50/25/25 (lifestyle/tax/monetary system)
You can make up any other, same as that people made
Is it possible to live from dividends?
How much do I need to live from dividends?
Those are typical questions i frequently see over the internet.
In practice: it depends
In theory, you just need to know 2 things:
- How much do you spend (the net + taxes and so on) ?
- What it is the avg return on your assets?
And the math goes… $Needs = P \times \frac{Yearly_Gross_Expenses}{(Yearly_returns)}$.
People mention about different strategies to estimate the returns:
- The 4% rule, which apparently is an estimate of what you can take from a portfolio without killing your principal every year
- Others just go with a dividend investing approach, so they dont need to sell shares
- And some people have a balance between stocks funds and bonds, so that if stock market goes down they can live with those bonds, without selling really cheap the stocks
There are many ways to estime when will yo be F.I.R.E - https://engaging-data.com/fire-calculator/
You also have the 5% rule for property investing 📌
The “5% Rule” in property investing can refer to a couple of different concepts, so it’s important to clarify which one is being discussed.
However, the most common interpretation in real estate investment analysis revolves around expected total return.
Here are the two primary ways the 5% rule is often used:
- The 5% Rule (Combined Return on Rent and Appreciation)
This is the most prevalent definition when discussing the “5% Rule” for evaluating the attractiveness of a real estate investment property.
Definition: This rule suggests that a real estate investor should aim for a combined annual return of at least 5% of the property’s purchase price, derived from the sum of its annual rental income and its expected annual appreciation in value.
How it Works:
- Estimate Annual Rent: Calculate the total annual rental income the property is expected to generate (monthly rent x 12).
- Estimate Annual Appreciation: Project the potential annual increase in the property’s market value. This requires research into market trends, historical appreciation rates in the area, and future development prospects.
- Calculate Total Returns: Add the estimated annual rent and the estimated annual appreciation amount.
- Assess Against Property Price: Divide the total returns by the initial purchase price of the property (including any immediate renovation costs) and convert it into a percentage.
Formula:
$$\text{5% Rule Return} = \left( \frac{\text{Annual Rent Income} + \text{Annual Property Appreciation}}{\text{Property Purchase Price}} \right) \times 100%$$
Significance:
- Benchmark: It serves as a quick benchmark to gauge whether a property is a potentially worthwhile investment. If the calculated percentage is 5% or higher, it might be considered a good opportunity.
- Balanced Approach: It encourages investors to consider both sources of return in real estate:
- Rental Yield (Cash Flow): The income generated from rent.
- Capital Appreciation: The increase in the property’s value over time.
- Risk Mitigation: By requiring a healthy combined return, it helps mitigate risks. A property that meets this threshold suggests it’s not overly reliant on just one source of return (e.g., extremely high appreciation but no cash flow, or vice versa).
- Simplicity: It provides a relatively simple rule of thumb for initial screening of properties.
Example: If you buy a property for $200,000, expect to rent it for $1,000 per month ($12,000 annually), and anticipate 3% annual appreciation ($6,000 annually): Total Return = $12,000 (Rent) + $6,000 (Appreciation) = $18,000 5% Rule Return = ($18,000 / $200,000) * 100% = 9% In this case, the property beats the 5% rule.
Limitations:
- Estimates: Relies on accurate estimations of future rent and appreciation, which can be uncertain.
- Doesn’t Account for Expenses: This simple rule doesn’t factor in other significant costs like property taxes, insurance, maintenance, vacancies, property management fees, or mortgage interest. These would be considered in a more detailed cash flow analysis.
- Market Specificity: What constitutes a “good” return can vary significantly by market. A 5% combined return might be excellent in a low-growth, high-yield market, but considered low in a high-growth, high-appreciation market.
2. The 5% Rule (Comparing Renting vs. Buying a Primary Residence)
Another less common but sometimes discussed “5% Rule” is a guideline for deciding whether it’s financially better to rent or buy a primary residence.
Definition: This version suggests that if the total annual “unrecoverable costs” of owning a home (property tax, maintenance, and opportunity cost of capital) exceed 5% of the home’s value, it might be more financially advantageous to rent a comparable property and invest the difference.
How it Works:
- Property Tax: Often estimated at around 1% of the home’s value annually.
- Maintenance Costs: Also estimated at around 1% of the home’s value annually for routine upkeep.
- Cost of Capital (Opportunity Cost): The remaining 3% accounts for the money you’ve tied up in a down payment and equity that could otherwise be invested elsewhere (e.g., in the stock market or other investment properties) earning a return.
Formula: $$\text{Annual Owning Costs %} = \text{Property Tax %} + \text{Maintenance Costs %} + \text{Opportunity Cost %}$$ If this percentage (typically targeted at 5%) is significantly higher than your equivalent annual rent for a similar property, then renting might be the better financial decision.
Significance: It provides a simplified framework for individuals to weigh the financial implications of homeownership beyond just mortgage payments, factoring in hidden costs and opportunity cost.
Like all rules of thumb, the “5% Rule” is a guideline, not a rigid law.
It’s a useful starting point for preliminary analysis but should always be supplemented with more detailed financial modeling, market research, and due diligence specific to the property and location.
If Python sounds like a very crazy thing to get started with: you can try with simple Google Sheets + Google Finance formula
Payout Ratio for Dividends
Make sure you learn and understand ew finance and dividend related concepts.
Like the payout ratio
The payout ratio is normally calculated using Earnings Per Share (EPS) or Net Income.
The most common formula is:
Payout Ratio = Dividends Per Share (DPS) / Earnings Per Share (EPS)
Alternatively, it can be calculated using total dividends and net income:
Payout Ratio = Total Dividends Paid / Net Income
While EPS/Net Income is the standard, some investors and analysts also use Free Cash Flow (FCF) to calculate a “Free Cash Flow Payout Ratio.”
This is because FCF can sometimes be a better indicator of a company’s ability to pay dividends, as it accounts for actual cash generated from operations and capital expenditures, whereas net income can be influenced by non-cash charges like depreciation.
However, when people generally refer to “the payout ratio,” they are most often referring to the calculation based on EPS or Net Income.
Net Income vs EPS 📌
Yes, you are absolutely correct! Earnings Per Share (EPS) is directly based on Net Income.
Here’s the fundamental relationship:
EPS = (Net Income - Preferred Dividends) / Weighted Average Shares Outstanding
Let’s break down each component:
Net Income: This is the “bottom line” profit of a company, found at the very end of the Income Statement. It represents the total revenue minus all expenses (cost of goods sold, operating expenses, interest, taxes, etc.).
Preferred Dividends: If a company has preferred stock, it must pay dividends to preferred shareholders before any earnings are available to common shareholders. Therefore, these dividends are subtracted from net income to arrive at the profit attributable solely to common shareholders.
Weighted Average Shares Outstanding: This is the average number of common shares that were in circulation during the reporting period. It’s used because the number of shares can change over time (due to stock issuances, buybacks, or splits). Using a weighted average provides a more accurate representation of the shares actually “earning” the profit throughout the period.
EPS takes the company’s total profit (Net Income, adjusted for preferred dividends) and divides it by the number of common shares, giving you a per-share measure of profitability.
It tells you how much of the company’s net profit is allocated to each outstanding share of common stock.
This makes EPS a very popular metric for investors because it normalizes a company’s profit down to a per-share basis, making it easier to compare the profitability of companies with different numbers of shares outstanding.
Payout Ratio 101 | Based on NetIncome vs FCF 📌
Net Income and Free Cash Flow (FCF) are both crucial metrics for evaluating a company’s financial health, but they tell different stories and are derived from different financial statements.
The fundamental difference lies in their focus:
- Net Income (also called Net Profit or the “bottom line”) focuses on a company’s profitability based on accrual accounting.
- Free Cash Flow (FCF) focuses on a company’s liquidity and its ability to generate actual cash available for discretionary use, after covering its operating expenses and necessary investments.
Let’s break down the key distinctions:
Net Income
- What it is: The final profit figure on a company’s Income Statement. It’s calculated by taking all revenues and subtracting all expenses, including operating expenses, interest, taxes, and non-cash expenses like depreciation and amortization.
- Accounting Method: Based on accrual accounting. This means revenues are recognized when earned (even if cash hasn’t been received yet), and expenses are recognized when incurred (even if cash hasn’t been paid yet).
- Key Components:
- Sales Revenue
- Cost of Goods Sold (COGS)
- Operating Expenses (Salaries, Rent, Marketing, R&D, etc.)
- Depreciation & Amortization (non-cash expense)
- Interest Expense
- Taxes
- Purpose: Shows how profitable a company is over a specific period (quarter, year). It’s a key indicator of a company’s earnings power.
- Limitations:
- Can be misleading regarding cash: A company can report high net income but have very little cash if, for example, most sales are on credit (Accounts Receivable) or if it has significant non-cash expenses.
- Subject to accounting estimates and choices: Depreciation methods, inventory valuation, and revenue recognition policies can impact net income without directly affecting cash.
- Doesn’t account for capital expenditures: It doesn’t show how much cash is needed to maintain or grow the business.
Free Cash Flow (FCF)
- What it is: The cash a company generates from its operations after accounting for the cash needed to maintain and expand its asset base (capital expenditures). It’s a measure of the cash truly “free” for the company to distribute to shareholders (dividends, buybacks), pay down debt, or pursue new investments without impacting core operations.
- Accounting Method: Based on cash accounting principles, starting from the Cash Flow Statement.
- Calculation (Common Formula):
$FCF = \text{Cash Flow from Operating Activities} - \text{Capital Expenditures (CapEx)}$
- Cash Flow from Operating Activities (CFO): This is typically found on the Cash Flow Statement. It adjusts net income for non-cash items (like depreciation, which is added back) and changes in working capital (like increases in accounts receivable or inventory, which consume cash, or increases in accounts payable, which provide cash).
- Capital Expenditures (CapEx): These are investments in property, plant, and equipment (PP&E) – the money spent on long-term assets needed to run and grow the business. This is found under “Investing Activities” on the Cash Flow Statement.
- Purpose: Shows the actual cash a company has available for discretionary uses. It’s often considered a more robust measure of financial health and value than net income because it’s harder to manipulate and reflects real cash in and out.
- Advantages:
- Truer picture of liquidity: Shows if a company can pay its bills, fund growth, and pay dividends from its own operations.
- Less susceptible to accounting manipulation: As it deals with actual cash movements.
- Directly relates to valuation: Many valuation models (like Discounted Cash Flow - DCF) are based on FCF.
Analogy
Think of it this way:
- Net Income is like your salary on your payslip before any deductions for taxes, retirement contributions, or even your daily coffee. It’s what you “earned” in theory.
- Free Cash Flow is like the actual cash you have in your bank account after your salary has been deposited, your taxes and bills have been paid, and you’ve bought your groceries and covered your basic living expenses and necessary investments (like fixing your car). It’s the money you have left over to save, invest, or spend on luxuries.
Why Both are Important
Both metrics are vital for a complete financial picture:
- Net Income helps assess a company’s profitability and efficiency in managing its revenues and expenses.
- Free Cash Flow helps assess a company’s liquidity, solvency, and ability to generate cash for long-term sustainability, growth, and shareholder returns (like dividends and buybacks).
A healthy company will generally have positive net income and positive free cash flow. Discrepancies between the two can indicate areas for further investigation (e.g., high net income but low FCF might mean aggressive revenue recognition or high capital intensity).
It’s very possible and actually quite common for a company to have positive Net Income (profit) but negative Free Cash Flow (FCF).
This is a crucial distinction that often surprises people new to financial analysis, and it highlights why both metrics are essential.
The core reason for this divergence lies in the fundamental difference between accrual accounting (used for Net Income) and cash accounting (which FCF ultimately reflects).
Accrual vs Cash | Accounting 📌
Here are the primary reasons why a profitable company might have negative FCF:
High Capital Expenditures (CapEx):
- Net Income: Only reflects the depreciation of assets, which is a non-cash expense spread over many years. When a company buys a new factory, machinery, or invests heavily in technology, that full cash outflow (CapEx) hits the cash flow statement in the year of purchase.
- FCF: Is calculated by subtracting Capital Expenditures from Operating Cash Flow. So, if a company is making significant investments for future growth, even if it’s profitable, these large cash outflows for CapEx will reduce or even turn its FCF negative.
- Example: A software company spends $100 million on R&D for a new product, which is expensed. It also spends $50 million on new data servers. Its Net Income might be positive, but that $50 million cash outflow for servers directly reduces FCF, even though the income statement only records depreciation of existing assets.
Increases in Working Capital (especially Accounts Receivable and Inventory):
- Net Income: Recognizes revenue when it’s earned, even if the cash hasn’t been collected yet (e.g., selling goods on credit). It also records expenses when incurred, not necessarily when paid.
- FCF: Is about actual cash.
- Growing Accounts Receivable: If a company sells a lot on credit but customers pay slowly, revenue and net income will look good. However, the cash isn’t in the bank. An increase in Accounts Receivable (money owed to the company) is a use of cash, reducing Operating Cash Flow and thus FCF.
- Building Inventory: If a company produces a lot of goods but they sit unsold in inventory, the costs associated with producing those goods are incurred (reducing net income), but the cash is tied up in inventory. An increase in Inventory is a use of cash, reducing FCF.
- Example: A retailer sells $1 million worth of goods, boosting net income. But $500,000 of those sales are on credit, and they also spend $300,000 building up inventory for the next season. Even with a positive net income, their cash flow could suffer significantly due to these working capital needs.
Timing Differences in Revenue and Expense Recognition (Accrual Accounting):
- Prepaid Expenses: A company might pay for insurance or rent for a full year upfront. This is a large cash outflow now, but the expense is recognized on the income statement gradually over the year. FCF takes the immediate cash hit, while net income is spread out.
- Deferred Revenue: A company receives cash upfront for services to be rendered in the future (e.g., annual subscriptions). This is a cash inflow, but the revenue isn’t recognized immediately on the income statement. While this would generally boost FCF relative to Net Income, other factors can still lead to negative FCF.
Non-Cash Expenses on the Income Statement:
- Depreciation and Amortization (D&A): These are the largest and most common non-cash expenses. They reduce net income but do not involve any current cash outflow. In the FCF calculation, D&A is added back to Net Income (or CFO is used, which already adds it back) because it’s not a cash expense. However, if CapEx (the actual cash spent on assets) is much higher than D&A, then FCF can still be negative.
- Stock-Based Compensation: This is an expense that reduces net income but doesn’t involve cash leaving the company. It’s also added back when calculating cash flow from operations.
Debt Repayments (Financing Activities):
- While not directly part of the FCF calculation (which focuses on operations and investments), significant debt repayments (principal, not interest) consume cash and can make a seemingly profitable company appear cash-strapped if one only looks at the overall cash position. FCF is cash before debt repayments, but if a company relies heavily on debt for growth, the need to service that debt can constrain the “free” cash.
In essence:
- Net income tells you how much money a company “made” according to accounting rules, considering when sales were earned and expenses incurred.
- FCF tells you how much actual cash the company has left after funding its ongoing operations and necessary investments.
A healthy company usually aims for both positive Net Income and positive Free Cash Flow.
A consistent disconnect (positive Net Income, negative FCF) can be a red flag, indicating that the company is burning cash, potentially relying on external financing, or struggling to convert its sales into actual cash.
However, a temporary negative FCF due to significant growth-oriented CapEx can be a good sign for future potential.
FAQ
GFinance with Google Sheets
You can have a simple, yet useful Google Sheets with Stocks info: https://support.google.com/docs/answer/3093281?hl=en
=GoogleFinance(S35;"eps") #S35 can reference some ticket, like NYSE:KO
=GoogleFinance(S35;"pe")

=GoogleFinance(S35;"pe")


=GoogleFinance("INDEXSP:.INX") #sp500

=INDICE(GoogleFinance("INDEXSP:.INX"; "price"; HOY()-365);2;2) #get the price 365 ago

=SPARKLINE(GoogleFinance("CURRENCY:EURCHF"; "price"; HOY()-90; HOY()))
=SPARKLINE(GoogleFinance("CURRENCY:"&"USD" & DERECHA(A6;3); "price"; HOY()-J$1; HOY()))
And if you need, you can also import info from other website sources:
- Import from ycharts:
=VALOR(IZQUIERDA(importxml(CONCATENAR("https://ycharts.com/companies/";REGEXEXTRACT(S33;"[^:]*$");"/profit_margin");$AJ$28);3))/100
#S33 is a ticker, NASDAQ:PEP, for example and AJ28 the XPATH
# =importxml("https://ycharts.com/companies/"& REGEXEXTRACT("NASDAQ:PEP";"\:(.*)") & "/profit_margin";$AI$28)
with xpath being
/html/body/div[3]/div[2]/section[1]/div/div/div[1]/div[2]/ul/li[1]/span[2]
- Import from numbeo:
=IZQUIERDA(importxml(C36;C37);6)/IZQUIERDA(importxml(C36;C38);6)With:
- C36
https://www.numbeo.com/cost-of-living/compare_cities.jsp?country1=Poland&country2=spain&city1=Warsaw&city2=barcelona&tracking=getDispatchComparison - C37
/html/body/div[2]/aside[1]/div[2]/div/span[1]/text() - C38
/html/body/div[2]/aside[1]/div[2]/div/span[3]
- Even from Etherscan for crypto related info!
=importxml("https://etherscan.io/address/some_address";"/html/body/main/section[3]/div[2]/div[1]/div/div/div[2]/div/div")Animating Stock Data
As you can imagine, you can get another ways to create animated stock data.
Data Animations with Python | Plotly + MoviePy + … 📌
It’s absolutely possible to create animations with Plotly, and you can export them as GIFs or MP4s.
Plotly itself doesn’t directly create MP4s, but you can achieve this using other tools in conjunction with Plotly.
Here’s a breakdown of how to create animations and export them in different formats:
1. Creating the Animation with Plotly:
Plotly’s frames argument is key to creating animations.
You essentially create a series of plots (frames), each representing a step in your animation, and then Plotly smoothly transitions between them.
import plotly.graph_objects as go

# Sample Data (replace with your own)
x_data = [1, 2, 3, 4, 5]
y_data_list = [[2, 1, 4, 3, 5], [1, 3, 2, 5, 4], [3, 2, 5, 1, 4]]

# Create Frames
frames = []
for i, y_data in enumerate(y_data_list):
    frame = go.Frame(data=[go.Scatter(x=x_data, y=y_data)], name=f"frame{i}") # Name is important for GIF export
    frames.append(frame)

# Create Figure with initial data
fig = go.Figure(
    data=[go.Scatter(x=x_data, y=y_data_list[0])], # Initial data
    layout=go.Layout(title="Animated Plot", updatemenus=[dict(type="buttons", buttons=[dict(label="Play", method="animate", args=None)])]),
    frames=frames
)

fig.show() # Display the interactive animation
2. Exporting to GIF:
- Using
kaleido(Recommended): Kaleido is a static image export utility for Plotly. It’s the easiest way to export to GIF.
import imageio # For GIF creation

images = []
for frame in fig.frames:
    fig.update_layout(scene=frame.layout) # Important for 3D plots
    img_bytes = fig.to_image(format="png")  # or "jpg"
    img = imageio.v2.imread(img_bytes)
    images.append(img)

imageio.mimsave("animation.gif", images, fps=2) # fps controls the animation speed
You’ll need to install kaleido and imageio: pip install kaleido imageio
- Alternative (if
kaleidohas issues): You could save each frame as a PNG and then use a separate tool (like ImageMagick) to combine them into a GIF. This is more complex.
3. Exporting to MP4:
Plotly doesn’t directly export to MP4.
You’ll need to use a video encoding library like moviepy.
from moviepy.editor import ImageSequenceClip

# ... (code from GIF export to create 'images' list) ...

clip = ImageSequenceClip(images, fps=2)
clip.write_videofile("animation.mp4", codec='libx264', audio=False) # libx264 is a common codec
You’ll need to install moviepy: pip install moviepy
Key Considerations:
fps(frames per second): Controls the animation speed. Adjust this inimageio.mimsaveorImageSequenceClip.codec(for MP4):libx264is a widely supported codec. You might need to install it separately on some systems (it’s often included withffmpeg, whichmoviepymay require).- File Size: GIFs can get very large. MP4s are usually more efficient for longer animations.
- 3D Animations: For 3D animations, make sure to update the
scenelayout in each frame before exporting to an image. The example code shows how to do this. - Interactivity: The interactive Plotly display (using
fig.show()) is different from the exported GIF or MP4. The exported files are static animations.
But at this point for me, matplotlib custom graphs + creating a gif or mp4 from them is what have worked the best.