Stocks with Python
TL;DR:
This is NOT a financial recommendation post.
Just have fun with Python and its different stacks.
Intro
Because they have made it, but you wont.
TradFi - Or Traditional Finances, as I saw recently on redit.
You can see how big the market is https://gomarketcap.com/
Wouldnt it be great to go out the typical google sheet and have a great UI/X when looking at your finances?
There are some tools which do exactly that.
But you miss the learnings of building one:
If all of these sounds familiar…
 Reflex StocksNEW Python Stocks (Streamlit)
It is because it is actually familiar.
Sometime ago I was doing similar Project in R Shiny 💻
 About RStocksRStocks Source Code
And it was not all about yahoo finance back then…
API’s I was using with R/Stocks 📌
- PriceR
- QuantDL - API required
- QuantMod
- yfR - yahoo finance in R
But this time, I thought to keep a simpler data architecture and just rely on yfinance queries.
But dont worry, that can be more than enough to fill a cool Python web app!
From google sheets we have the possibility to query data from stocks:
=SPARKLINE(GoogleFinance("NYSE:KO"; "price"; HOY()-60; HOY()))
=GoogleFinance("NYSE:KO")
=SI.ERROR(GoogleFinance("NYSE:KO";"pe");999)
=GoogleFinance("NYSE:KO";"eps")
From its price, to PER/EPS… of a stock
Unfortunately, no dividend data is given out of the box
The Idea: and objectives
Business Side:
- To feed a portfolio:
- To see consolidated information
- To see value and dividend % CAGR for a past period
- To let the user play with future what if scenarios (given just percentages of growth for those parameters)
- Reply to typical questions
Tech Side:
- To choose the webapp framework that looks the coolest (on web and phone): streamlit vs Flask vs Reflex…
- And that I can plug user authentication easily
- To see whats the best way for me to authencate users: clear/supabase/logto…
I kind of understood authentication and Flask webapps with:
And Reflex is kind of cool, but the LLMs are not there yet to do the code for you:
PyStocks
There are cool apps out-there: https://openalternative.co/maybe
But I wanted to build mine and learn something more along the way.
The structure looks like:
- _index.md
- _index.md
- getting-started.md
- _index.md
- organize-files.md
- _index.md
- post-1.md
From the MultiChat and Aissistant Ive tried to bundle streamlit features on different pages.
So that the main app.py can be very simple/modular and clean.
The Data Source
This time is going to be yfinance based.
That I also covered recently on this post: https://jalcocert.github.io/JAlcocerT/python-financial-data-with-yfinance/
Im aware that there are many APIs around: https://github.com/public-apis/public-apis
And yesss people are earning a lot of money building APIs and you are ,missing out'
Just leave that money on the table.
YFinance data and a Python Web App…That’s it!
Less is more
Or so some say
Anyways, we will need this package: https://pypi.org/project/yfinance/
pip install yfinance==0.2.61And as I dont really like building stuff on data source I dont control: I added the possibility to saved into sqlite the pulled data.
You just pull once philosophy
User Interaction
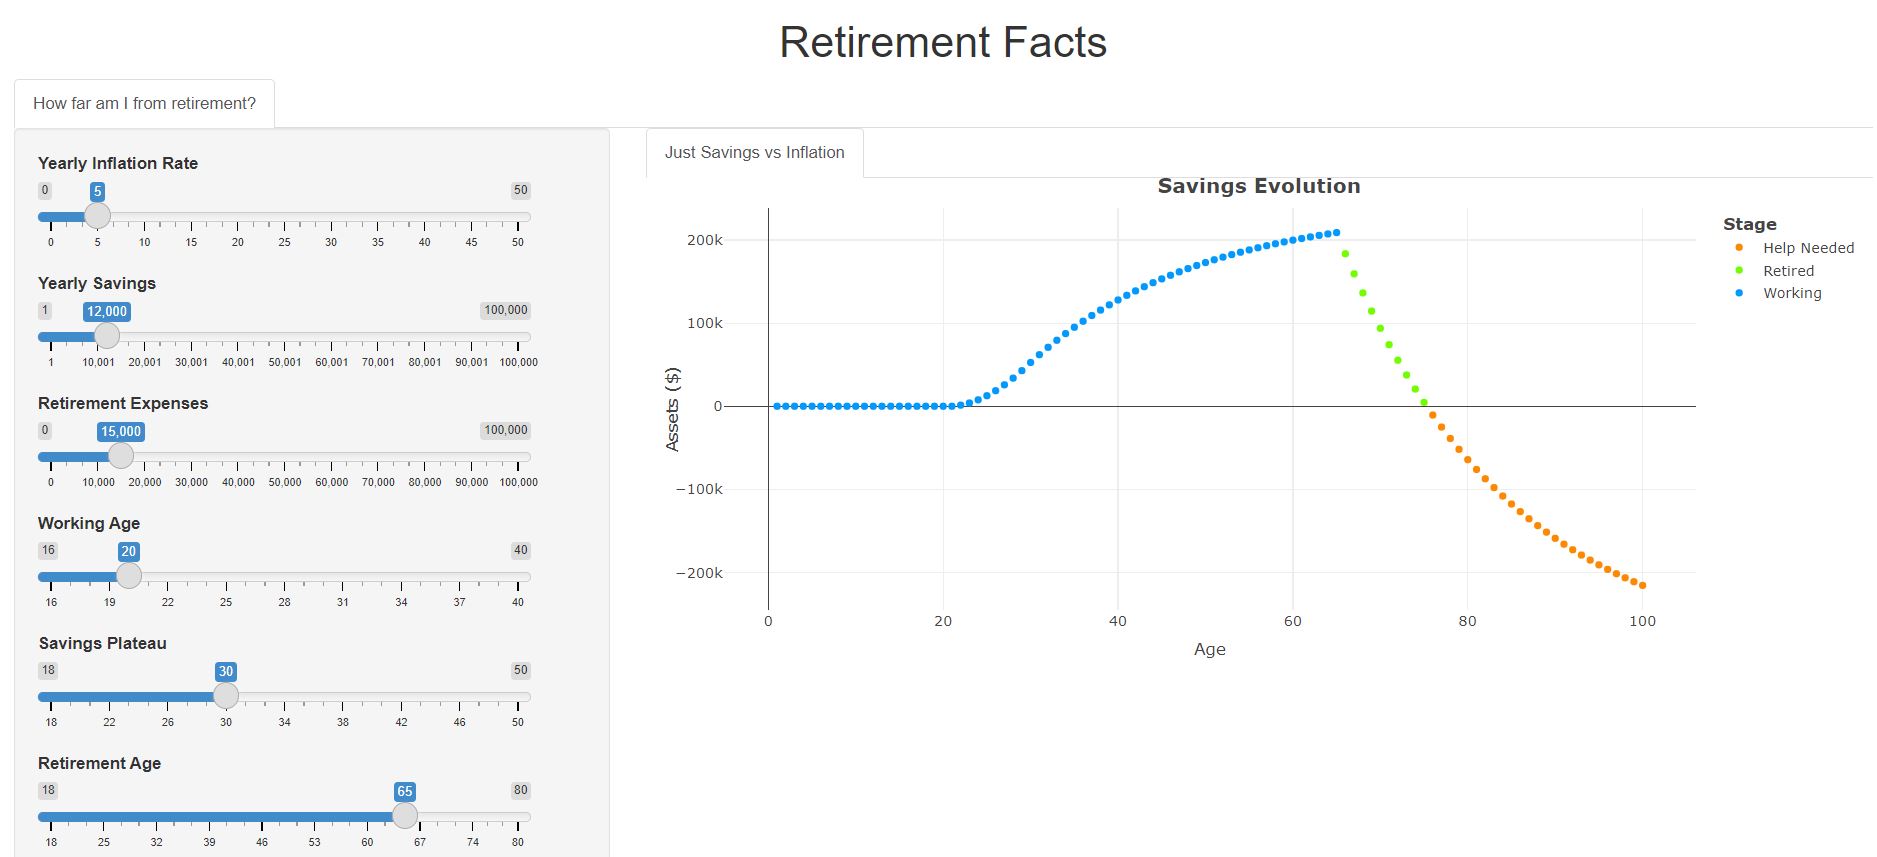
The user will potentially be curious about that ‘what if’ for its assets.
So why not giving the possibility to feed a sample Google Sheet with its sharable link to the webapp?
The Charts
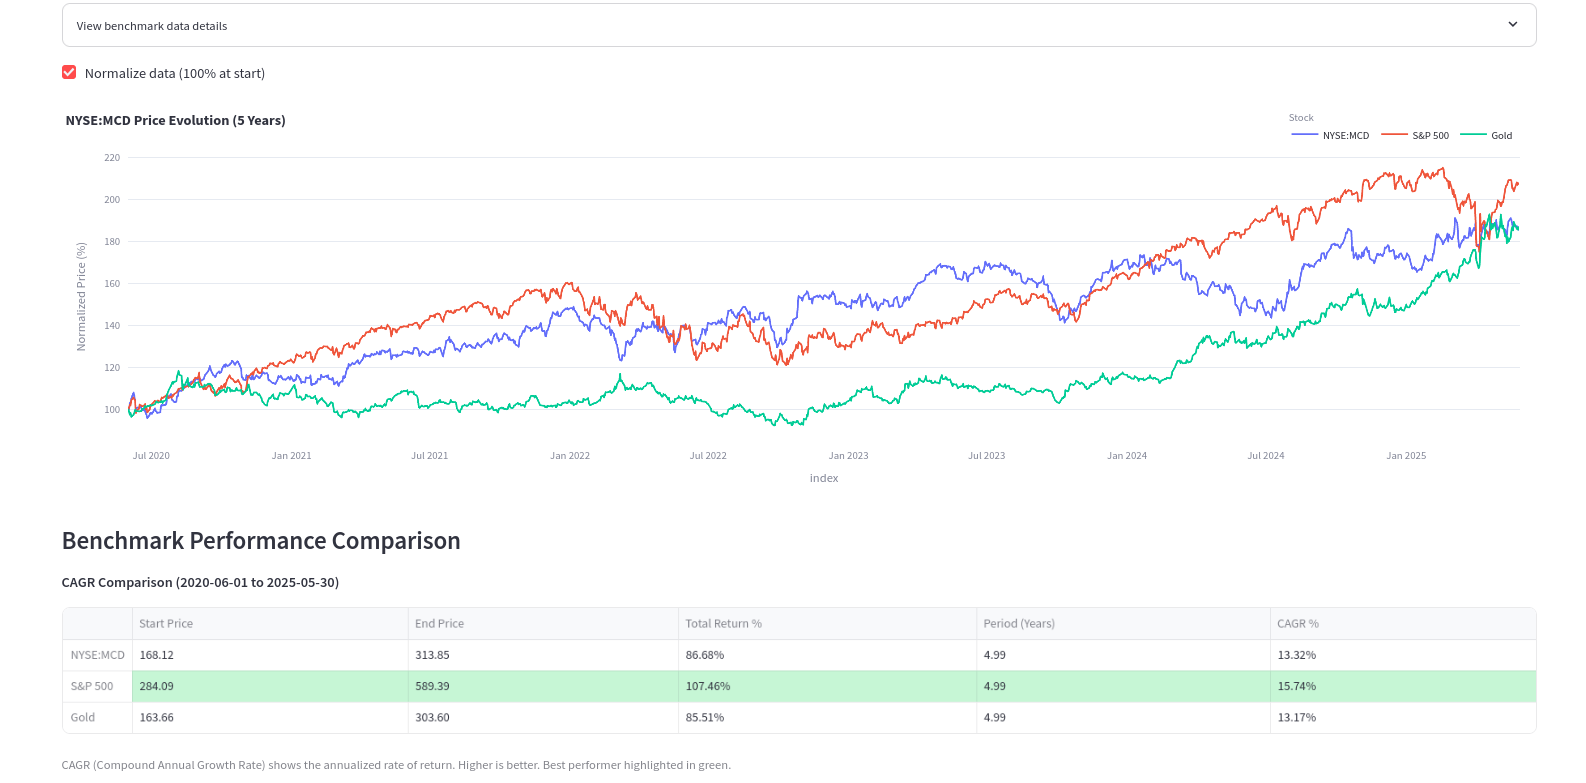
I wanted to have a simple growth comparison (and actually the vibez added this cool normalized view)
PyGWalker
How about giving the possibility to build your own visuals?
That’s where the pygwalker use case comes in to any streamlit app.
AI Features for PyStocks
This is very yolo mode.
Do you really want to make these decions based on a LLM?
Nooot the best idea.
But since grok allows for real time information retrieval since not long ago, that can be very interesting to see.
We could also chat with the pulled financial data thanks to LangChain
Chat with a DB applied for finance - https://github.com/JAlcocerT/Data-Chat/tree/main/LangChain/PyStocksDB
Conclusions
This goes few steps further than the previous project RStocks.
And I got streamlit working with my google sheets to bring my portfolio information (as per the transactions history that I maintain manually):
About RStocksNEW Python StocksAnd definitely much more than FlexDashboards in R.
Wouldnt this be a cool companion for a website, as a lead magnet?
Even as a subscription based model, say 7$/month to have access to such tool and historical info?
People are on money making mode on amazon ebooks with much simpler concepts.
And with webapps like:
- https://www.simplysafedividends.com/
- https://www.dividenddata.com/ This one uses Shiny!
- You can also see historical dividends for companies at nasdaq
- https://blog.wisesheets.io/google-finance-dividend-yield-a-guide/
FAQ
ETF like LON:IDUS vs Dividends like O?
Why not both with
NASDAQ:DGRW?
It’s all about that non existing cristal ball to see the future.
Together with the math problem of: low yield + high growth vs high yield + low growth
You can try and solve this via the CAGR
But you will be oversimplifying the fact that you got cash on hand earlier with the latter option
Stock Questions - Answered
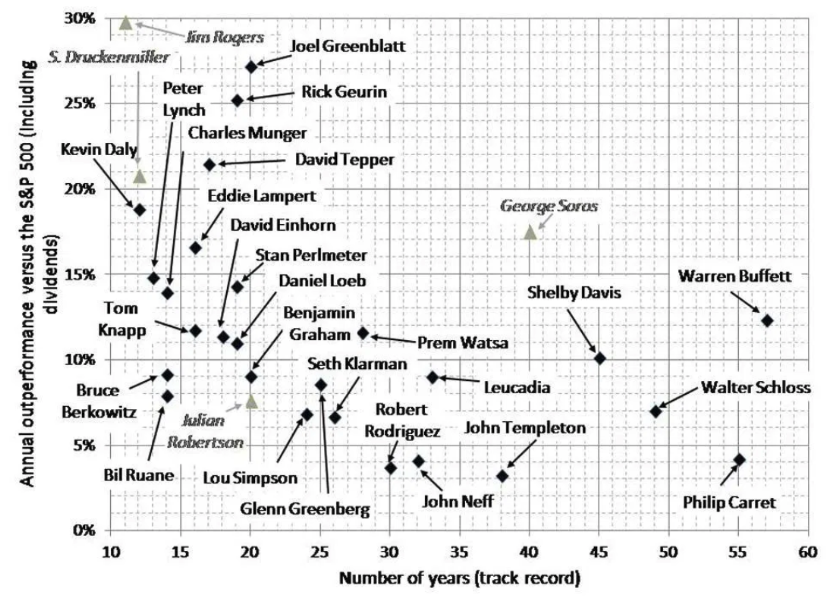
Stocks overperforming SP500 in xyz period / last xyz months
YoC when I stopped investing at a certain point of time (Dave van Knapp made a all in approach, but it can serve to see what happens after a DCA strategy)
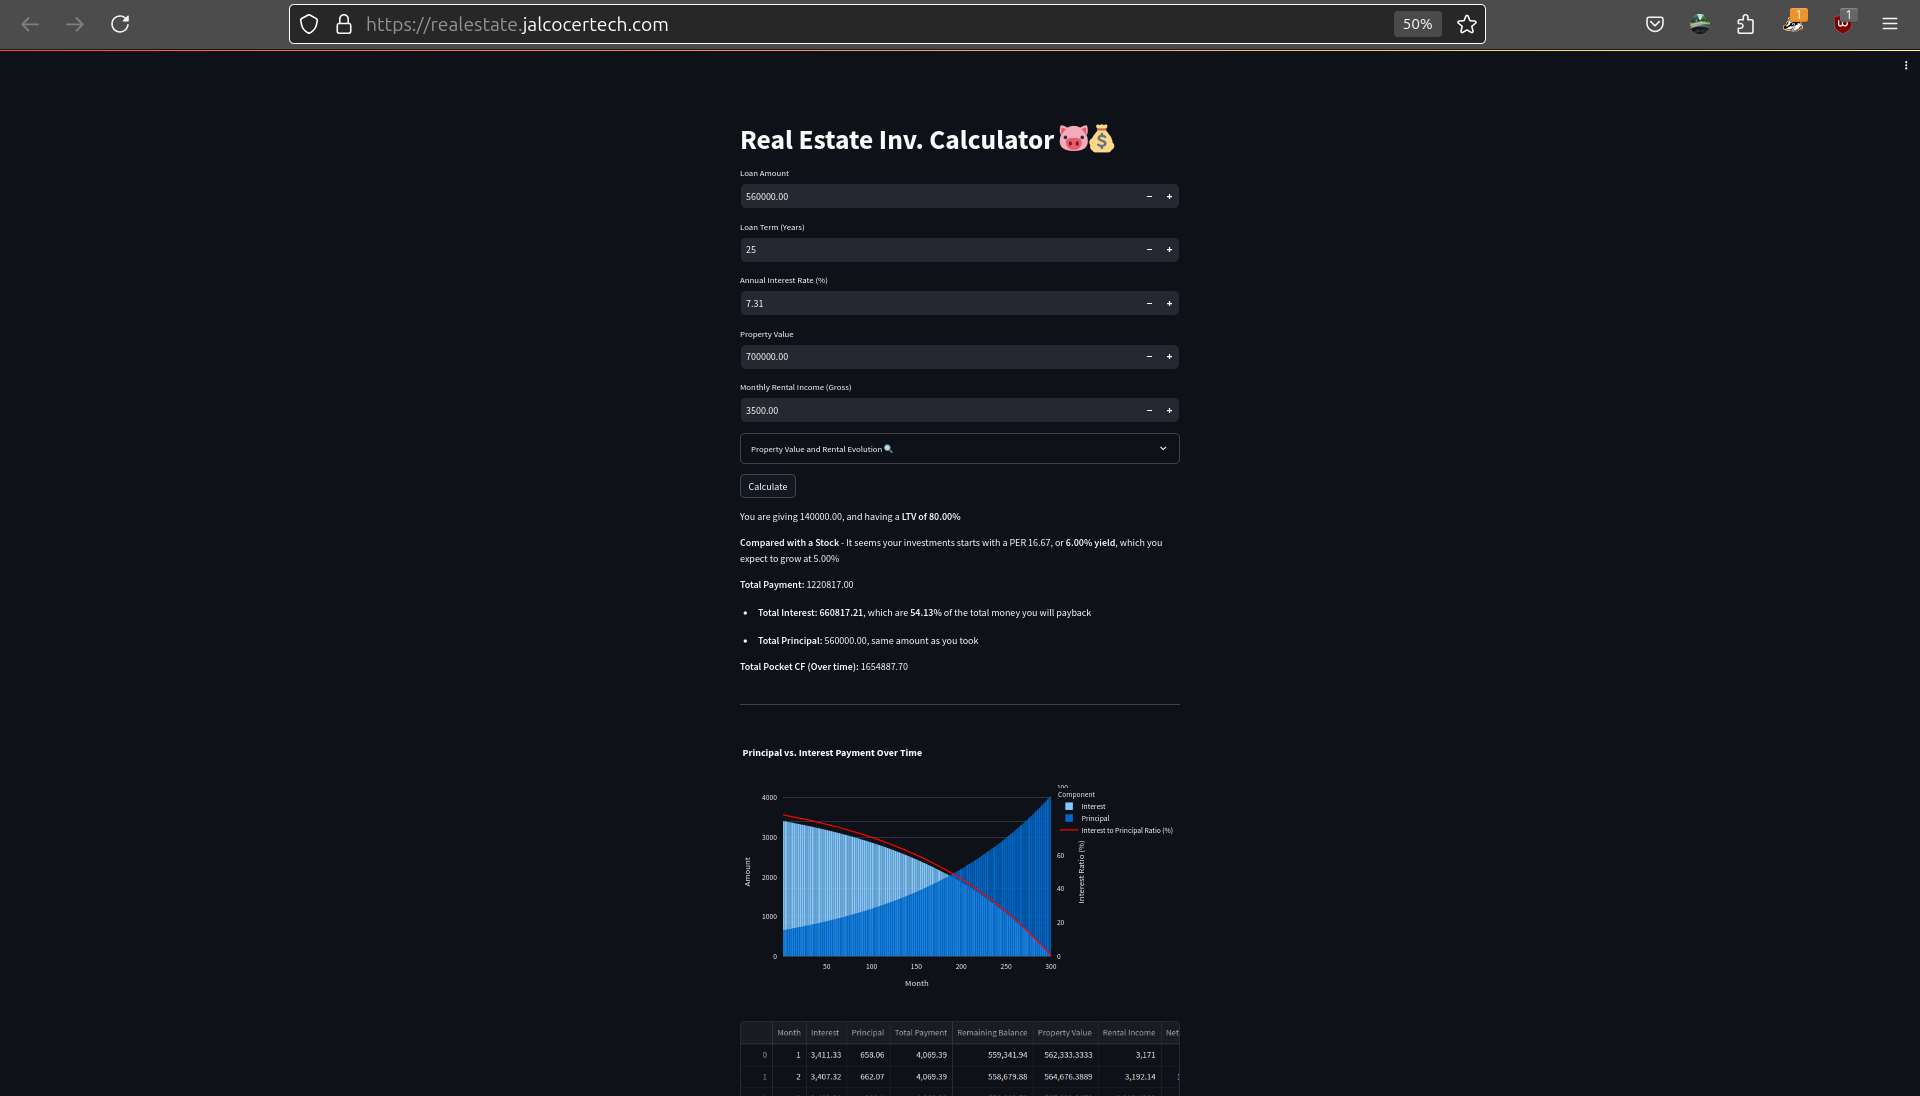
In the meantime, I got to understand how French amortization works (typical for mortage payments).
See, the French amortization formula: $A = P \times \frac{r(1 + r)^n}{(1 + r)^n - 1}$.
I also got time to compare different SP500 ETFS performance:
LON:SPY5(SPY5.L) dist usd 0.09% IE00B6YX5C33 Link to JustETF profileLON:VUAA, acc usd 0.07% IE00BFMXXD54 Link to JustETF profile- In GSheets, you have the SP500 index under the name
INDEXSP:.INX
Interesting Pkgs I got to learn
- Data Load Tool - https://github.com/dlt-hub/dlt
the open-source Python library for data loading
How to inspect a SQL DB with AI (without knowing much about it…)
Interesting Financial Parameters / KPIs 📌
Revenue:
- Gross Revenue: Total income from sales.
- Net Revenue: Gross revenue minus returns and discounts.
Expenses:
- Operating Expenses: Costs incurred during normal business operations.
- COGS (Cost of Goods Sold): Direct costs of producing goods.
- Non-operating Expenses: Costs not related to core operations (e.g., interest payments).
Assets & Liabilities:
- Current Assets: Cash or items convertible to cash within a year.
- Long-term Assets: Assets held for more than a year (e.g., machinery).
- Current Liabilities: Debts due within a year.
- Long-term Liabilities: Debts payable over a longer period.
Valuation Metrics:
EBITDA (Earnings Before Interest, Taxes, Depreciation, and Amortization): Indicates operational profitability.
Net Cash Flow: Difference between cash inflows and outflows.
Debt-to-Equity Ratio: Indicates the level of financial leverage.
Yield: Dividend return relative to share price; calculated as
Dividends per Share / Market Price per Share.Payout Ratio: Proportion of earnings paid out as dividends; calculated as
Dividends / Net Income.PER (Price-to-Earnings Ratio): A valuation measure comparing share price to earnings per share.
PEGI (Price/Earnings to Growth Index): PER adjusted for expected earnings growth; calculated as
PER / Annual EPS Growth.PEGY (Price/Earnings to Growth and Yield): PER adjusted for both expected earnings growth and dividend yield; calculated as
PER / (Annual EPS Growth + Dividend Yield).
Financial Terminology Explained
- P/E Ratio (PER): The P/E Ratio indicates how much investors are willing to pay for each dollar of a company’s earnings.
- Forward P/E Ratio (Forward PER): The Forward P/E Ratio is an estimate of a company’s P/E ratio using forecasted future earnings, offering a forward-looking valuation.
- Forward Yield (Forward Yield PER): Forward Yield estimates the expected dividend yield of a stock over the next year based on projected future dividends.
- P/E Last 5Y Percentile: This metric shows where a company’s current P/E ratio stands relative to its P/E ratios over the past five years, helping assess if it’s trading high or low historically.
- 5Y Avg P/E: The 5-year Average P/E is the average of a company’s P/E ratio over the last five years, providing a benchmark for its typical valuation.
- Yield Growth 1Y/5Y/10Y: This term measures the percentage increase in a company’s dividend yield over one, five, or ten years, showing its history of growing payouts.
- Payout Ratio: The Payout Ratio indicates the percentage of a company’s earnings paid out to shareholders as dividends, reflecting how much profit is returned versus reinvested.
- PEG Ratio (PEG): The PEG Ratio compares a company’s P/E ratio to its expected earnings growth rate, used to determine if a stock’s price is reasonable relative to its growth potential.
- PEGI: PEGI (Price/Earnings Growth Index) is a less common variation of the PEG ratio, sometimes incorporating additional factors beyond just earnings growth.
%%{init: {"flowchart": {"htmlLabels": false}} }%%
flowchart TD
    A["Net Cash Flow"] <--> B["Cash Inflows"]
    A <--> C["Cash Outflows"]
    B --> D["Revenue, Investments, Financing"]
    C --> E["Operating Expenses, Investments, Dividends"]
    E --> F["Dividends"]
    F --> G["Payout Ratio"]
    G --> H["Dividends / Net Income"]

    A -- "Positive Net Cash Flow supports" --> F
    A -- "Negative Net Cash Flow impacts ability to pay" --> F
    G -- "High Payout Ratio limits reinvestment" --> A
Net Income vs Net Cash Flow 📌
Net Income is not the same as Net Cash Flow.
They are related but measure different aspects of a company’s financial health:
Net Income:
- Represents a company’s profit or loss during a specific period.
- Found on the income statement.
- Includes both cash and non-cash items:
- Revenues minus all expenses, including non-cash expenses like depreciation and amortization.
- Accrual-based (recognizes income/expenses when they are earned/incurred, not when cash changes hands).
Net Cash Flow:
- Measures the actual cash movement into and out of the company during a specific period.
- Found on the cash flow statement.
- Focuses on cash inflows and outflows, ignoring non-cash items!.
- Composed of three parts:
- Operating Cash Flow: Cash generated from core business activities.
- Investing Cash Flow: Cash used in or generated by investments in assets.
- Financing Cash Flow: Cash used for or received from debt, equity, and dividends.
| Aspect | Net Income | Net Cash Flow |
|---|---|---|
| Definition | Profit or loss from operations (accounting basis) | Actual cash generated or used (cash basis) |
| Non-cash items | Includes non-cash items (e.g., depreciation) | Excludes non-cash items, tracks cash only |
| Timing | Accrual-based accounting | Tracks when cash is received or spent |
| Use | Measures profitability | Measures liquidity and financial flexibility |
Relationship:
Net Income is often the starting point for calculating Operating Cash Flow.
Adjustments are made to add back non-cash expenses and account for changes in working capital.
Both metrics are important:
- Net Income: Indicates profitability.
- Net Cash Flow: Shows the company’s ability to generate cash and stay solvent.
A diagram is worth more than xyz words, right?
%%{init: {"flowchart": {"htmlLabels": false}} }%%
flowchart TD
    A["Company Financials"] --> B["Revenue"]
    A --> C["Expenses"]
    A --> D["Assets & Liabilities"]
    A --> E["Valuation Metrics"]

    B --> F["Gross Revenue"]
    B --> G["Net Revenue"]

    C --> H["Operating Expenses"]
    C --> I["Cost of Goods Sold (COGS)"]
    C --> J["Non-operating Expenses"]

    D --> K["Current Assets"]
    D --> L["Long-term Assets"]
    D --> M["Current Liabilities"]
    D --> N["Long-term Liabilities"]

    B --> O["`**EBITDA**`"]
    C --> O
    O --> Z["Revenue - Operating Expenses"]

    B --> P["`**Net Cash Flow**`"]
    C --> P
    P --> AA["Cash Inflows - Cash Outflows"]

    G --> Q["`**PER (Price-to-Earnings Ratio)**`"]
    Q --> BB["Market Price per Share / EPS"]

    D --> R["`**Debt-to-Equity Ratio**`"]
    R --> CC["Total Debt / Total Equity"]

    E --> S["`**Yield**`"]
    S --> DD["Dividends per Share / Market Price per Share"]

    E --> T["`**PEGI (Price/Earnings to Growth Index)**`"]
    T --> EE["PER / Annual EPS Growth"]

    E --> U["`**Payout Ratio**`"]
    U --> FF["Dividends / Net Income"]
How to use AI LLM Agents to get posts with this program as Source
Interesting Financial Stories
These are a collection of finance related posts/sites that have been somehow interesting for me to read:
https://dividendsandincome.com/author/dave-van-knapp/ - Interesting story about someone who made a one time investment 15y+ ago (Dave)
https://dividendsandincome.com/2024/04/08/how-my-dividend-growth-portfolios-income-keeps-expanding/
There are interesting free calculators on the internet: which I got to know thanks to Damiem Talks Money YT Channel
https://www.thecalculatorsite.com/finance/calculators/compoundinterestcalculator.php
https://www.thecalculatorsite.com/finance/calculators/how-long-will-my-money-last
https://www.thecalculatorsite.com/finance/calculators/cagr-calculator.php
How exactly?
With an AIssistant or with agents / MCP
And how to publish it?
You can also publish it on a website, like https://readmake.com/
Which uses the obfuscate technique unless you have paid via stripe, where you will get the full copy :)
MIT | Astro-obfuscate is a set of components that prevent spam bots from finding email addresses, phone numbers, or other text that you wish to hide.
There are some python projects to do obfuscation as well
Interesting Financial Data WebSites
https://www.multpl.com/- It has Sp500 PE Ratios, 10y treausry rates…
https://stockanalysis.com/ esta es buena para stocks, etfs no
https://www.justetf.com/uk/ esta es un screener de ETFs muy bueno, además están todas las variantes monetarias de cada ETF
https://www.digrin.com/stocks/detail/IDUS.L/
- Interesting payout ratio, dgr,…
https://divvydiary.com/en/?via=elisa&gad_source=1&gclid=Cj0KCQiA0fu5BhDQARIsAMXUBOIN8XXGkoEZZbfhufMr55Y2kSIuAGXDP4Lb1LYgLlRMnezpTUl2tkAaAp2kEALw_wcB esta la encontré el otro día, ofrece datos históricos de stocks y algún ETF (FUSD te lo da pero IDUS no), pero mola que me da el ISIN rápido, entonces veo rápidamente en qué país cotiza
https://tools.mhinvest.com/mhichart una web app que tiene una idea muy parecida a la que pensamos en su momento, pero no considera seguir metiendo gasolina, parte de una cantidad inicial y listo.
https://www.nasdaq.com/market-activity/stocks/mcd/price-earnings-peg-ratios
https://observationsandnotes.blogspot.com/2009/01/impact-of-price-to-earnings-ratios.html
https://observationsandnotes.blogspot.com/2013/03/what-will-my-bond-cd-be-worth-in-years.html
PE vs 1year returns, very interesting thought which reminds us about regression to the mean https://observationsandnotes.blogspot.com/2012/03/scatter-diagram-pe-stock-market-return.html
https://observationsandnotes.blogspot.com/2011/03/stock-market-100-year-inflation-history.html
Financial Data Apps
Outro
Thanks to
- Hugo Hextra Latex/Katex Syntax
- Thanks to Streamlit/Flask for the foundations for the web/app.
VBA vs OpenPyxl
And all of this could have just been done in plain excel…
What is openpyxl?
- Python Library:
- openpyxl is a Python library used to read and write Excel .xlsx files. This means you can use Python code to interact with Excel spreadsheets.
- It allows you to automate tasks like:
- Reading data from Excel files.
- Writing data to Excel files.
- Modifying existing Excel files (formatting, adding/removing sheets, etc.).
- Purpose:
- It’s designed to work with the Office Open XML format, which is the underlying structure of modern Excel files (.xlsx).
openpyxl vs. Excel Macros (VBA)
- Macros (VBA):
- Excel macros are created using Visual Basic for Applications (VBA), a programming language built into Excel.
- They are used to automate tasks within Excel itself.
- Macros are stored within the Excel file.
- openpyxl (Python):
- openpyxl is a Python library that operates externally to Excel.
- It allows you to manipulate Excel files from your Python scripts.
- Python code is separate from the Excel file.
- Key Differences:
- Location: Macros live inside the Excel file; openpyxl scripts are external.
- Language: Macros use VBA; openpyxl uses Python.
- Functionality:
- openpyxl excels at data manipulation, formatting, and file structure changes.
- Macros are often used for automating repetitive tasks within the Excel user interface (e.g., button clicks, custom functions).
- Macros and openpyxl interaction:
- openpyxl itself does not execute VBA macros.
- It also does not fully preserve all aspects of macro enabled excel files(.xlsm). There are limitations when attempting to save .xlsm files after they have been worked on by openpyxl.
- However, you can use Python libraries like
win32comto interact with Excel’s application object and potentially run macros. But this is a different method than openpyxl’s native functionality.
- Can you do similar things?
- In many cases, yes, you can achieve similar automation results with openpyxl as you would with macros.
- For data-centric tasks, openpyxl is often more powerful and flexible due to Python’s extensive libraries.
- For tasks that require direct interaction with the Excel user interface, macros might be more suitable.
In summary:
- openpyxl is a powerful tool for working with Excel files programmatically.
- While it doesn’t directly replace VBA macros, it provides a robust alternative for many automation needs.