A [Recap] on R Language.
TL;DR
Get R installed, an IDE and play with it
Intro
Its been a while since I have done some project/tasks with R.
But recently, I had an idea to put a Flexdashboard inside a .mdx post for Astro websites.
And this thing worked perfectly…
But how can explain to someone whats going on?
Well…
R Setup
Lets get R language installed first:
sudo apt update
sudo apt install -y software-properties-common apt-transport-https
sudo apt update
sudo apt install r-base #this is ~150mb to get installed
sudo apt install pandoc #and this around ~200mbSee that R is ready with:
R --versionRight now im getting the 4.3.3 R version for x86.
IDE Setup
As always, anything will work…but vscode was not the popular one for R.
I used RStudio, which has been renamed to post:
wget https://download1.rstudio.org/electron/jammy/amd64/rstudio-2024.12.0-467-amd64.deb
sudo dpkg -i rstudio-2024.12.0-467-amd64.deb
sudo apt-get install -f #with dependencies
rstudio #open it

#R.version #test the R CLI inside rstudioWhere are we working now?
getwd()
setwd("~/Documents/acoolproject")
R Dependencies Setup
There are few ways to install packages with R, just remember about:
install.packages("leaflet", dependencies = TRUE)
install.packages("leaflet.extras")

install.packages("remotes")
#remotes::install_github('rstudio/flexdashboard')
Features I Love in R
Maps
Geospatial Data is awsome, and most of the times unused.
At some point I was putting together .GPX files with the help of https://www.youtrack.es
But you can do it also with some script.
- References:
- https://r-craft.org/r-and-gpx-how-to-read-and-visualize-gpx-files-in-r/
- https://trafficonese.github.io/leaflet.extras/reference/omnivore.html
- https://www.kaggle.com/code/miguelfzzz/cool-dashboard-in-r-with-youtube-tutorial/report?scriptVersionId=74682468
- https://rfun.library.duke.edu/portfolio/mapping_workshop/
- https://rfun.library.duke.edu/portfolio/dashboard_workshop/
- https://rfun.library.duke.edu/portfolio/shiny_workshop/
You might enjoy Having a look to PhyPhox
Put simply, GPX stands for GPS eXchange Format 🌍
And it’s nothing but a simple text file with geographical information, such as latitude, longitude, elevation, time, and so on.
If you plot these points on a map, you’ll know exactly where you need to go, and what sort of terrain you might expect, at least according to the elevation.
You will also hear about GeoJSON format, KML, TopoJSON
Animations
Generally, plots in R got me in love: https://r-graph-gallery.com/
And people even created gifs with R:
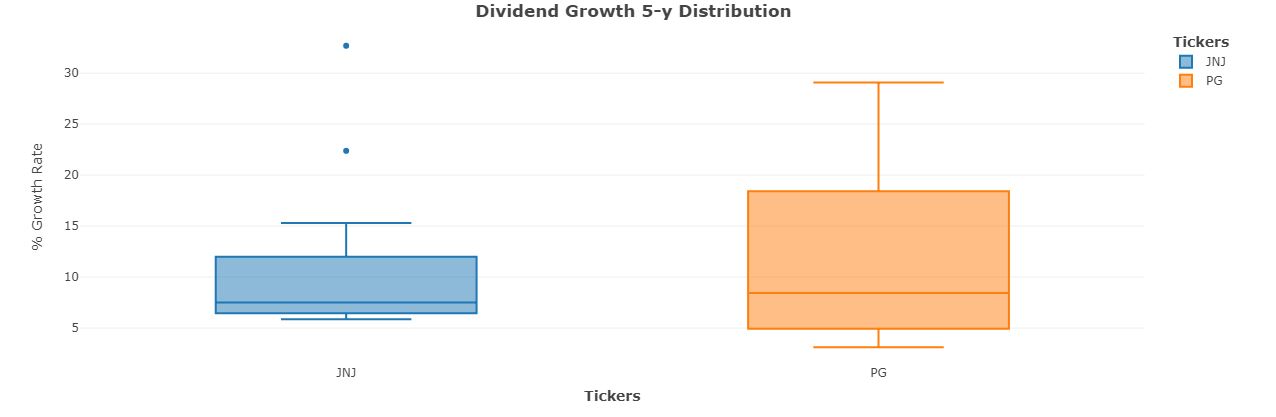
FlexDashboards
One of my favourite tools with R language: flexdashboards.
The cool thing?
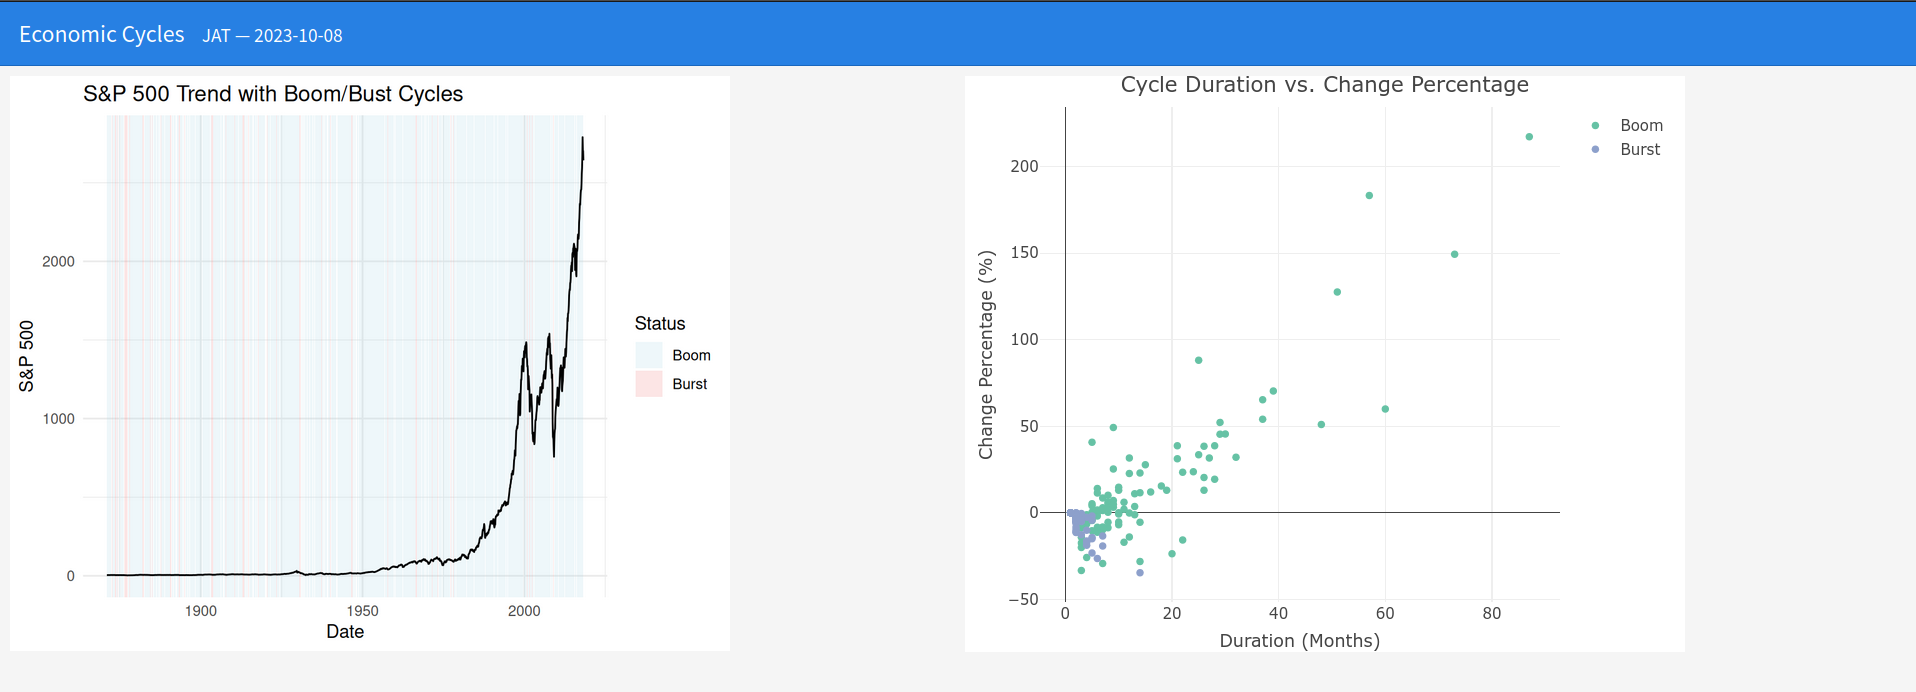 FlexDashboard RStocks
 RStocks Repository
We can have leaflet maps, HTML widgets, even animations inside of these cool static dashboards!
They can be enhanced with:
- https://pkgs.rstudio.com/flexdashboard/
- https://cloud.r-project.org/web/packages/flexdashboard/index.html
- https://github.com/rstudio/flexdashboard
install.packages("flexdashboard") #flexdashboard package from CRAN
remotes::install_github('rstudio/flexdashboard') #development version of the package, install it from GitHub via the remotes package
And now render the dashboard:
Rscript -e "rmarkdown::render('z_my_dashboardv2.Rmd')"
python3 -m http.server 8001 #or 8001 if thats taken...FlexDashboard with Github Pages and Github Actions
Github Actions is an awsome and free CI/CD tool to use.
GH Actions workflow for FlexDashboards to Github Pages 📌
Shiny
With Shiny, I created my very first web app.
And it was a really interesting learning!
In the meantime, there is now Shiny for Python.
Which can be something to try in the future and compare with streamlit or flask.
Containers for Shiny Apps
It was a ride to get the Shiny app working inside a container.
Moslty because of some dependency that my app needed.
https://jalcocert.github.io/JAlcocerT/building-r-shiny-apps-container-image-with-docker/
what happened in the end?
That it worked and also, there are 3 ways on doing that (depending on the base image you choose).
Conclusions
These are two related repos with examples of whats discussed: