BI Tools for the AI era
Intro
If you have interact with the data & analytics space, at some point you had to build a dashboard.
Yet again, there are several tools out there.
What should you focus on?
PowerBI, tableau and Looker are quite popular.
But there are few more that you can try from your laptop:
Business Intelligence and IoT
The BIA world & IoT can be bridge thanks to these visualization tools.
How about real time data analytics?
Real-Time Analytics with ClickHouse:
- ClickHouse Use Cases
- Superset: An open-source data exploration and visualization platform that supports ClickHouse as a data source.
- Metabase: An open-source business intelligence tool with ClickHouse integration.
- Tableau, Looker, Power BI: Commercial BI tools that may have connectors or integrations with ClickHouse.
SuperSet
- https://superset.apache.org/docs/installation/docker-compose
- https://jalcocert.github.io/RPi/posts/rpi-gps-superset/
git clone https://github.com/apache/superset.git
cd Superset
#docker compose up

git checkout 3.0.0
#git status

TAG=3.0.0 docker compose -f docker-compose-non-dev.yml pull
TAG=3.0.0 docker compose -f docker-compose-non-dev.yml up

#TAG=3.0.0 docker compose -f docker-compose-non-dev.yml up -d
Superset works perfectly with Trino SQL!
- https://superset.apache.org/docs/installation/installing-superset-using-docker-compose/
- https://github.com/apache/superset
MetaBase
- https://www.opensourcealternative.to/project/LightDashs
- https://www.opensourcealternative.to/project/Metabase
I tried MetaBase for Analytics with a Pi and a DHT sensor:
- https://jalcocert.github.io/RPi/posts/rpi-iot-dht1122-mongo/#metabase-dht-sensor-visualization
- https://jalcocert.github.io/RPi/img/metabase-mongoDB.JPG
Redash
Redash is an open-source data visualization and dashboarding tool that is commonly used in the field of data analytics and business intelligence.
It helps organizations and individuals query, visualize, and share data from various data sources (35+) to gain insights and make data-driven decisions.
Make Your Company Data Driven. Connect to any data source, easily visualize, dashboard and share your data.
I have added the Redash 🐳 Compose logic to: https://github.com/JAlcocerT/Docker/tree/main/IoT/Redash
More About Redash
Data Connection: Redash allows users to connect to a wide range of data sources, including relational databases (e.g., PostgreSQL, MySQL), NoSQL databases (e.g., MongoDB), data warehouses (e.g., Amazon Redshift, Google BigQuery), REST APIs, and more. This versatility enables data analysts to work with data from multiple sources in a unified platform.
Querying: Users can create SQL queries and run them within Redash to extract and transform data. The tool provides a user-friendly query builder interface, making it accessible to users with varying levels of SQL expertise.
Visualization: Redash offers a variety of visualization options, including charts, graphs, and pivot tables, to help users explore and understand their data. It supports popular charting libraries like Chart.js, Plotly, and more, allowing for customizable and interactive visualizations.
Dashboards: Users can combine multiple visualizations and queries into interactive dashboards. These dashboards can be customized and shared with others, making it easy to communicate insights and monitor key performance indicators (KPIs).
Collaboration: Redash supports collaboration among team members by allowing them to share queries, dashboards, and insights. This promotes knowledge sharing and facilitates data-driven decision-making within organizations.
Scheduled Reports: Redash enables users to schedule and automate the generation of reports and dashboards, which can be sent via email or other channels. This feature is useful for regularly distributing updated data and insights to stakeholders.
Embedding: Redash provides options for embedding visualizations and dashboards into other applications or websites, allowing for seamless integration of data analytics capabilities into existing workflows.
Data Governance: Redash provides role-based access control and data source integration, helping organizations maintain data security and governance standards.
Redash is a versatile data analytics tool that simplifies the process of querying, visualizing, and sharing data from various sources.
You can use this Docker-Compose to SelfHost Redash.
Get Redash running locally with docker-compose
Grafana
- For the tinkers out there, see: Grafana, Kibana and Chronogaph
- For the IoT Fans:
Designing Graphana Panels…with Python? 📌
If you have ever recorded a VBA macro to see the general structure and then tweak it, this is going to be familiar.
When you will find the use case that several similar pannels have to be created: for example for anomaly detection on 100 servers, or 50 different apps you have to monitor…
…you can define the first panel via Grafana UI, see how one panel look and then make Python do the rest for you.
IMPORTANT: you need to keep different panel id and positions across the dashboard
# Main Execution
file_path = "Grafana-Initial.json"  # Replace with your file path

iterate_data = extract_site_info_from_file(file_path)

# if iterate_data:
#     panels = []
#     for site, panel_id, grid_x, grid_y in iterate_data:
#         panel_json = create_elasticsearch_stat_panel_with_filter(site, grid_x, grid_y, panel_id)
#         panels.append(json.dumps(panel_json))

#     output_json = "[" + ",".join(panels) + "]"
#     print(output_json)
# else:
#     print("Failed to extract site information.")
Then, you will take the JSON and carefully add it respecting other dashboard areas you might have (this includes the very end of it, where you have the dashboard uid and so on)
The good thing about Grafana is how many data sources we can use it with:
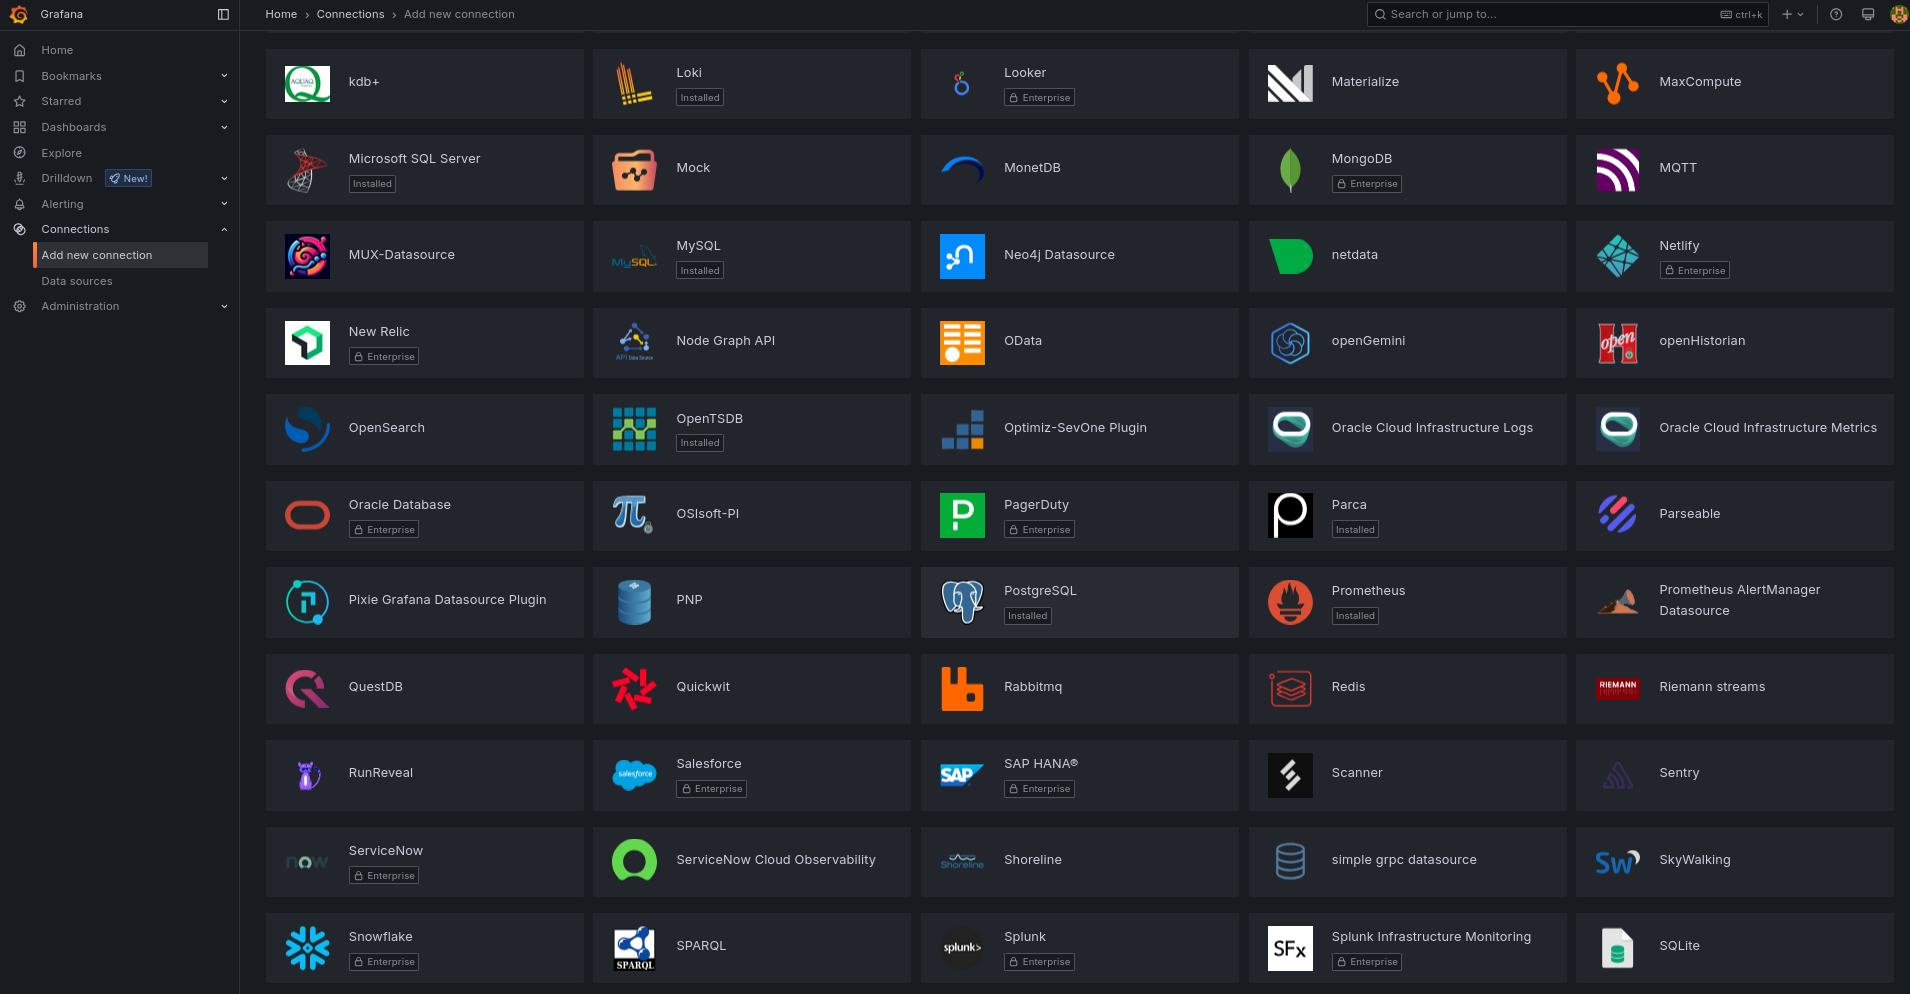
There are many Grafana stacks and applications, like LGTM: Loki, Grafana, Tempo and Prometheus
What can I do with LGTM? Summarized from Fireship 📌
Ever wondered how programmers build software? If builders built houses the way programmers build software, the first woodpecker to come along would destroy civilization.
In this video, Fireship, a popular YouTube creator, takes us on a journey to instrument, collect, and visualize telemetry data from our server using open telemetry and the LGTM stack.
The LGTM stack consists of five technologies:
- Open Telemetry: An industry-standard framework that collects telemetry data from software.
- Grafana: The front-end UI for visualizing data.
- Prometheus: A time-series database for storing metrics.
- Tempo: A database for storing traces.
- Loki: A database for storing logs.
Setting Up the LGTM Stack
To get started:
- Server Setup: Fireship recommends using Hostinger, which offers a variety of hosting services, including a Linux virtual private server (VPS) suitable for this project.
- Deploying LGTM Back-end: The LGTM back-end can be deployed using a Docker image provided by Graphon.
- Server Access: After setting up your server on Hostinger, you can access the management dashboard and connect via SSH.
Running Grafana
- Verify Docker: Use a Docker command to confirm the Docker daemon is running.
- Run Docker Image: Pull the Docker image for OTel LGTM from the cloud, which may take a minute.
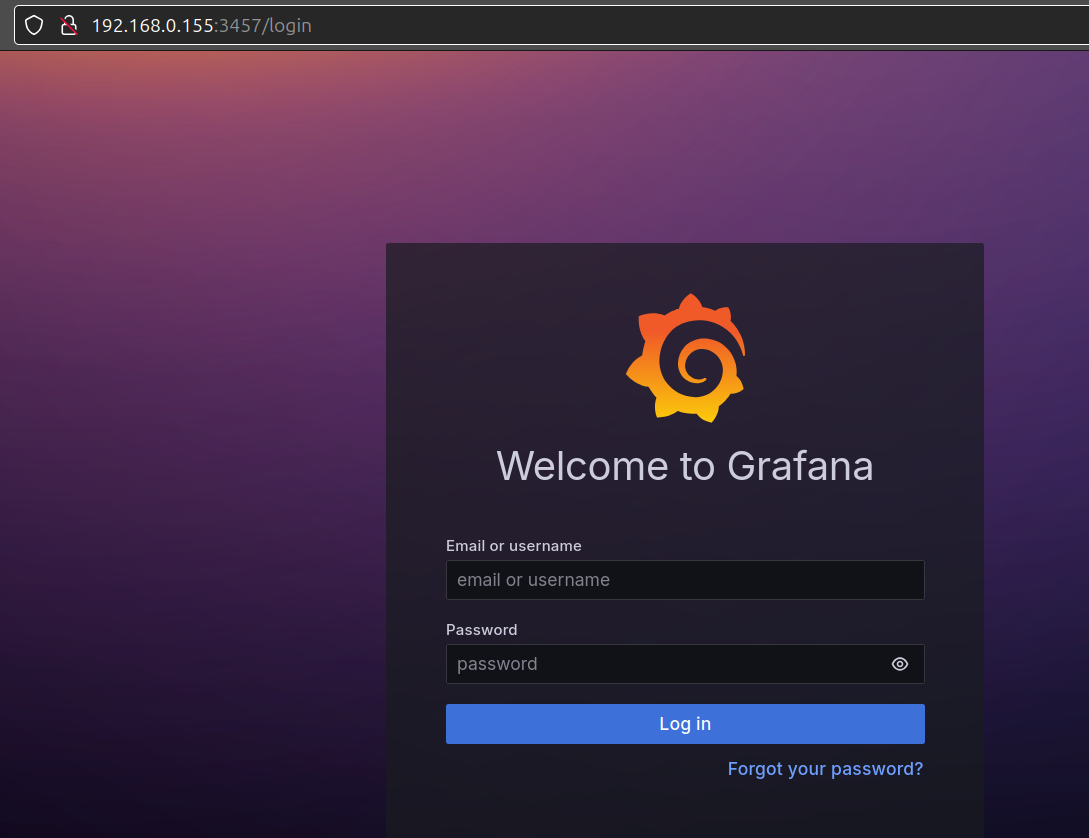
- Access Grafana: Open the browser and navigate to the IP address on port 3000 to log into Grafana as admin.
Connecting to a Data Source
Grafana alone is not useful unless connected to a data source.
Fireship demonstrates how to connect Loki, Prometheus, and Tempo, and then populate them with data using a sample application built with Dino, a framework with built-in telemetry support.
Analyzing Data with Grafana
With the LGTM stack up and running:
- Use Grafana to explore logs, metrics, and traces.
- Use Prometheus’ query language to analyze and dive deeper into your data to identify errors and anomalies.
Takeaways
- The LGTM stack provides a holistic approach to software observability, enabling you to instrument, collect, and visualize telemetry data from your server.
- With the right tools, you can identify errors and anomalies in your application, allowing for data-driven decisions to improve your software.
- Security is crucial when deploying a telemetry back-end. Services like Hostinger offer built-in protections against harmful traffic and threats.
- Grafana with Graphite StatsD
- Grafana with InfluxDB (Temperature measuring)
- Grafana with Proxmox and InfluxDB
- Grafana with Proxmox and Graphite
- Grafana with Node-Red
- Grafana + cAdvisor
Kibana
Lucene Queries in Kibana & Grafana
- KQL: Kibana Query Language for data filtering: https://www.elastic.co/guide/en/kibana/current/kuery-query.html
- Lucene Queries: Used in Grafana for more complex data analysis and machine learning.
| Feature | KQL (Kibana) | DSL (Grafana) |
|---|---|---|
| Purpose | Query language for Kibana | Query language for Elasticsearch |
| Syntax | Simple text-based | More complex and verbose |
| Use Cases | Filtering data in Kibana dashboards, visualizations, and Discover | Querying Elasticsearch for data analysis and machine learning |
KQL queries are ultimately translated into Elasticsearch Query DSL queries before being sent to Elasticsearch.
DSL Sample: https://www.elastic.co/guide/en/elasticsearch/reference/current/query-dsl.html
{
  "query": {
    "prefix": {
      "node.keyword": {
        "value": "FN-LC0001"
      }
    }
  }
}
{
"query": {
"bool": {
"must": [
{
"match_phrase": {
"site": "BBK-LC0011"
}
},
{
"exists": {
"field": "HttpPlayerPlaybackEndEvent_assetType"
}
}
]
}
}
}And for Kibana KQL logic, we would do:
viewerID : * and site : "AD04" and (HttpPlayerPlaybackEndEvent_assetType : * or HttpPlayerStartEvent_assetType : * )Lucene is the foundation, providing the core search capabilities.
KQL is a user-friendly layer built on top of Elasticsearch, simplifying common searches.
Elasticsearch DSL is the most powerful and flexible query language, allowing for complex and precise searches.
Kibana Queries - KQL, DSL, Lucene… 📌
Understanding Kibana Query Languages
Lucene Query Syntax:
- Lucene is a powerful full-text search engine library. Elasticsearch, which Kibana uses, is built on top of Lucene.
- Lucene’s query syntax is quite low-level and can be complex, involving boolean operators, field names, wildcards, and more.
- Directly writing Lucene queries can be cumbersome for many users.
Kibana Query Language (KQL):
- KQL is a user-friendly query language designed specifically for Kibana. It simplifies the process of searching and filtering data in Elasticsearch.
- It provides a more intuitive syntax compared to raw Lucene, making it easier for users to construct queries.
- KQL is ultimately translated into Lucene queries behind the scenes.
- KQL is designed to be very human readable.
Elasticsearch Domain-Specific Language (DSL):
- Elasticsearch DSL is a JSON-based query language that provides a more flexible and powerful way to interact with Elasticsearch.
- It allows for complex queries, aggregations, and other operations that might be difficult or impossible to express using KQL.
- DSL is the raw Json that is sent to elasticsearch.
- While KQL is converted to a Lucene query, that lucene query is then wrapped in a DSL Json object.
Relationship to Lucene Queries
- Both KQL and DSL are ultimately translated into Lucene queries.
- KQL acts as a higher-level abstraction, simplifying the process for users.
- DSL provides the most control, as it is the direct Json that is sent to elasticsearch.
With DSL you can do cool things, like the contain filter:
{
  "query": {
    "wildcard": {
      "SOME_ES_SOURCE.metric.keyword": "*gponPonOltsideOpInfoTxOpticalSignalLevel*"
    }
  }
}
Translating Your KQL Query to DSL
Your KQL query is:
viewerID : * and site : "somename" and (HttpPlayerPlaybackEndEvent_assetType : * or HttpPlayerStartEvent_assetType : * )Here’s how to translate it into Elasticsearch DSL:
{
  "query": {
    "bool": {
      "must": [
        {
          "wildcard": {
            "viewerID": {
              "value": "*"
            }
          }
        },
        {
          "term": {
            "site.keyword": {
              "value": "somename"
            }
          }
        },
        {
          "bool": {
            "should": [
              {
                "wildcard": {
                  "HttpPlayerPlaybackEndEvent_assetType": {
                    "value": "*"
                  }
                }
              },
              {
                "wildcard": {
                  "HttpPlayerStartEvent_assetType": {
                    "value": "*"
                  }
                }
              }
            ]
          }
        }
      ]
    }
  }
}
Explanation of the DSL:
"query": {"bool": {"must": [...]}}: This defines a boolean query, where allmustclauses must match."wildcard": {"viewerID": {"value": "*"}}: This matches any value in theviewerIDfield."term": {"site.keyword": {"value": "AD04"}}: This matches the exact term “AD04” in thesite.keywordfield. Note that if the site field is not set as a keyword, then the term query would be “site” instead of “site.keyword”."bool": {"should": [...]}: This defines a boolean query, where at least oneshouldclause must match."wildcard": {"HttpPlayerPlaybackEndEvent_assetType": {"value": "*"}}: This matches any value in theHttpPlayerPlaybackEndEvent_assetTypefield."wildcard": {"HttpPlayerStartEvent_assetType": {"value": "*"}}: This matches any value in theHttpPlayerStartEvent_assetTypefield.
Key Points:
- When dealing with exact string matches in Elasticsearch, it’s often best to use the
.keywordsub-field if it exists. This ensures that the entire string is matched as a single term. - Wildcard queries can be expensive, so try to be as specific as possible.
- DSL provides much more control, and is required for more complex queries.
Others
- Chronograph
Works together with InfluxDB!
Chronograf allows you to quickly see the data that you have stored in InfluxDB so you can build robust queries and alerts.
It is simple to use and includes templates and libraries to allow you to rapidly build dashboards with real-time visualizations of your data.
- Node-Red: is more for IoT, but it can be used for Data Analysis as well
Custom BI Tools
For the Devs out there
Or just vibe coders… :)
Python DASH
Python STREAMLIT
In theory you could get streamlit into an exe… https://ploomber.io/blog/streamlit_exe/
But most importantly, you can build custom BI and PoCs with it:
 Streamlit PoC Post
 Streamlit PoC
- Streamlit + AI
- Dynamic Maps with Streamlit
Streamlit + LeafMap:
What it is based on? https://github.com/opengeos/leafmap
A Python package for interactive mapping and geospatial analysis with minimal coding in a Jupyter environment
With a Very Interesting Marker cluster Page and a Page to upload your Vector Data (.geojson) and be able to visualize it.
- Streamlit + Folium
- Streamlit Reacting to clicks on a Leaflet Map - Also with Folium
Python Shiny
Shiny is now available for more than the R language.
We can now use Shiny with Python to create WebApps.
MIT | Effortless Python web applications
FlexDashboards with R
If you need a recap on R language, focused on flexdashboards:
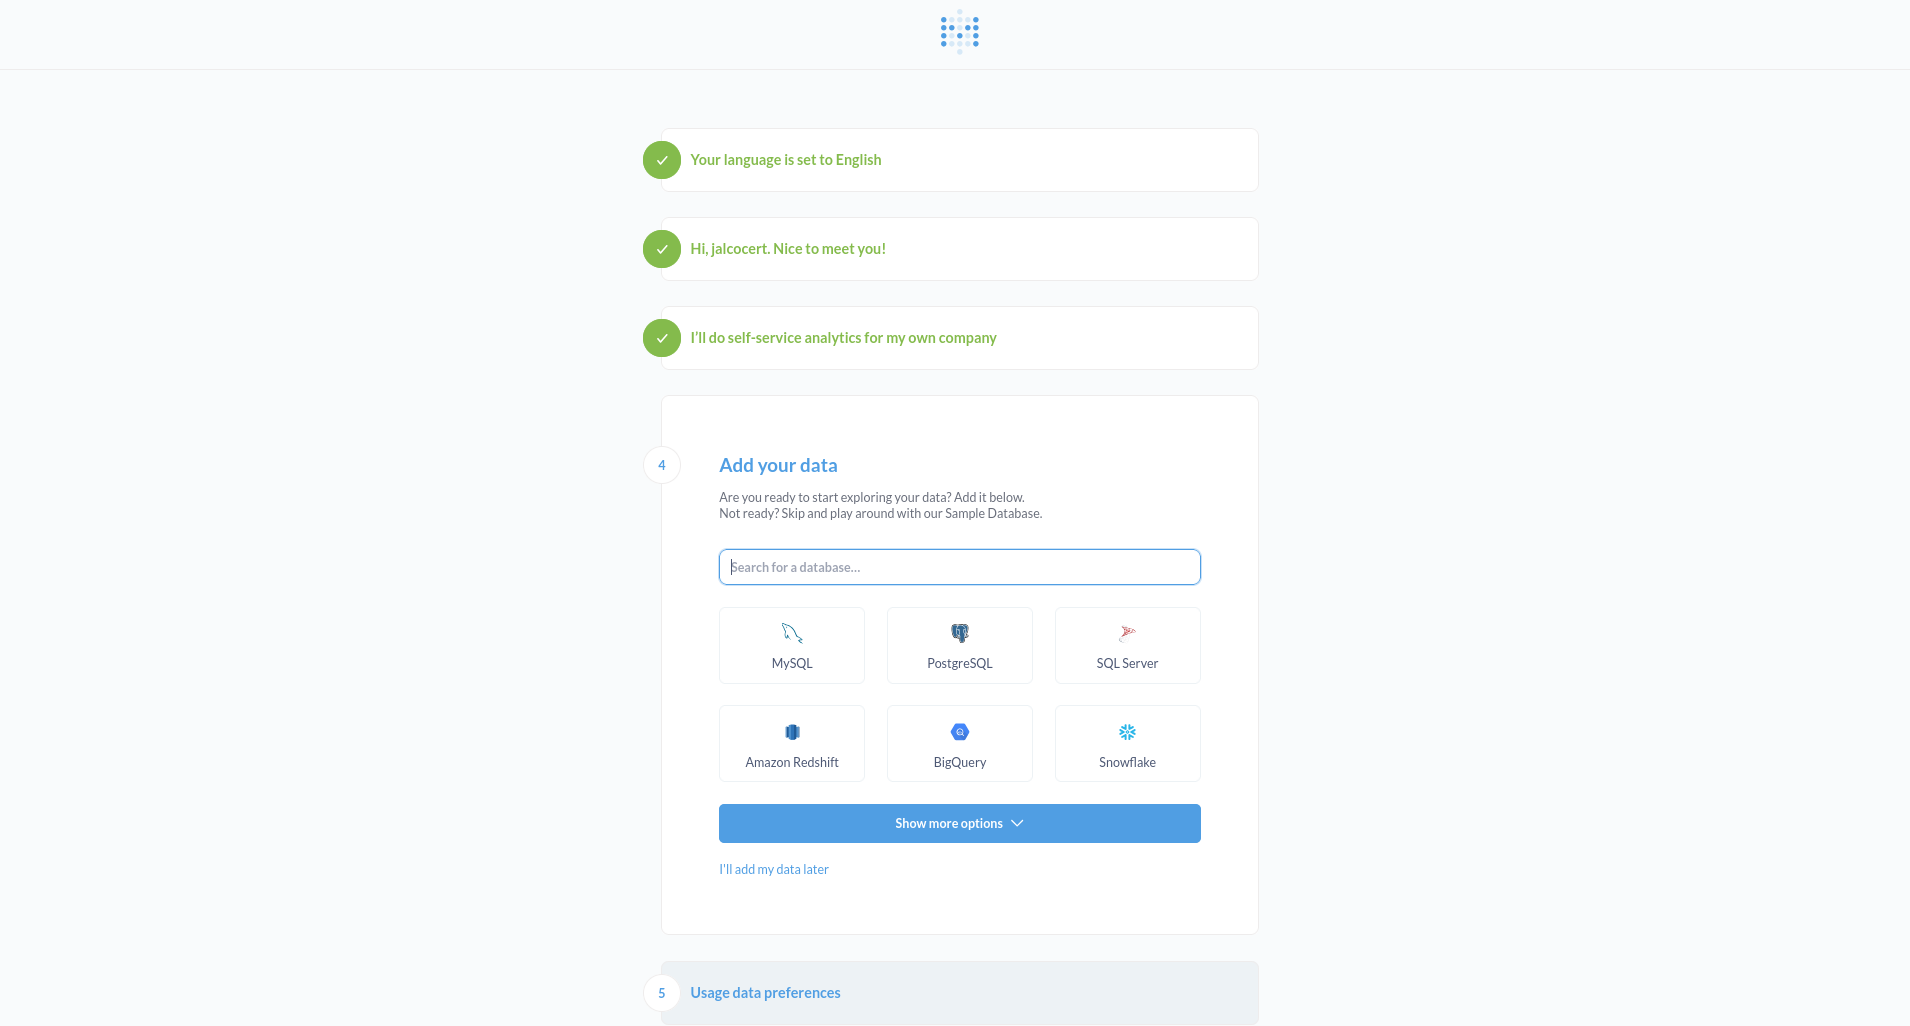
Metabase
Get Metabase running locally with docker-compose
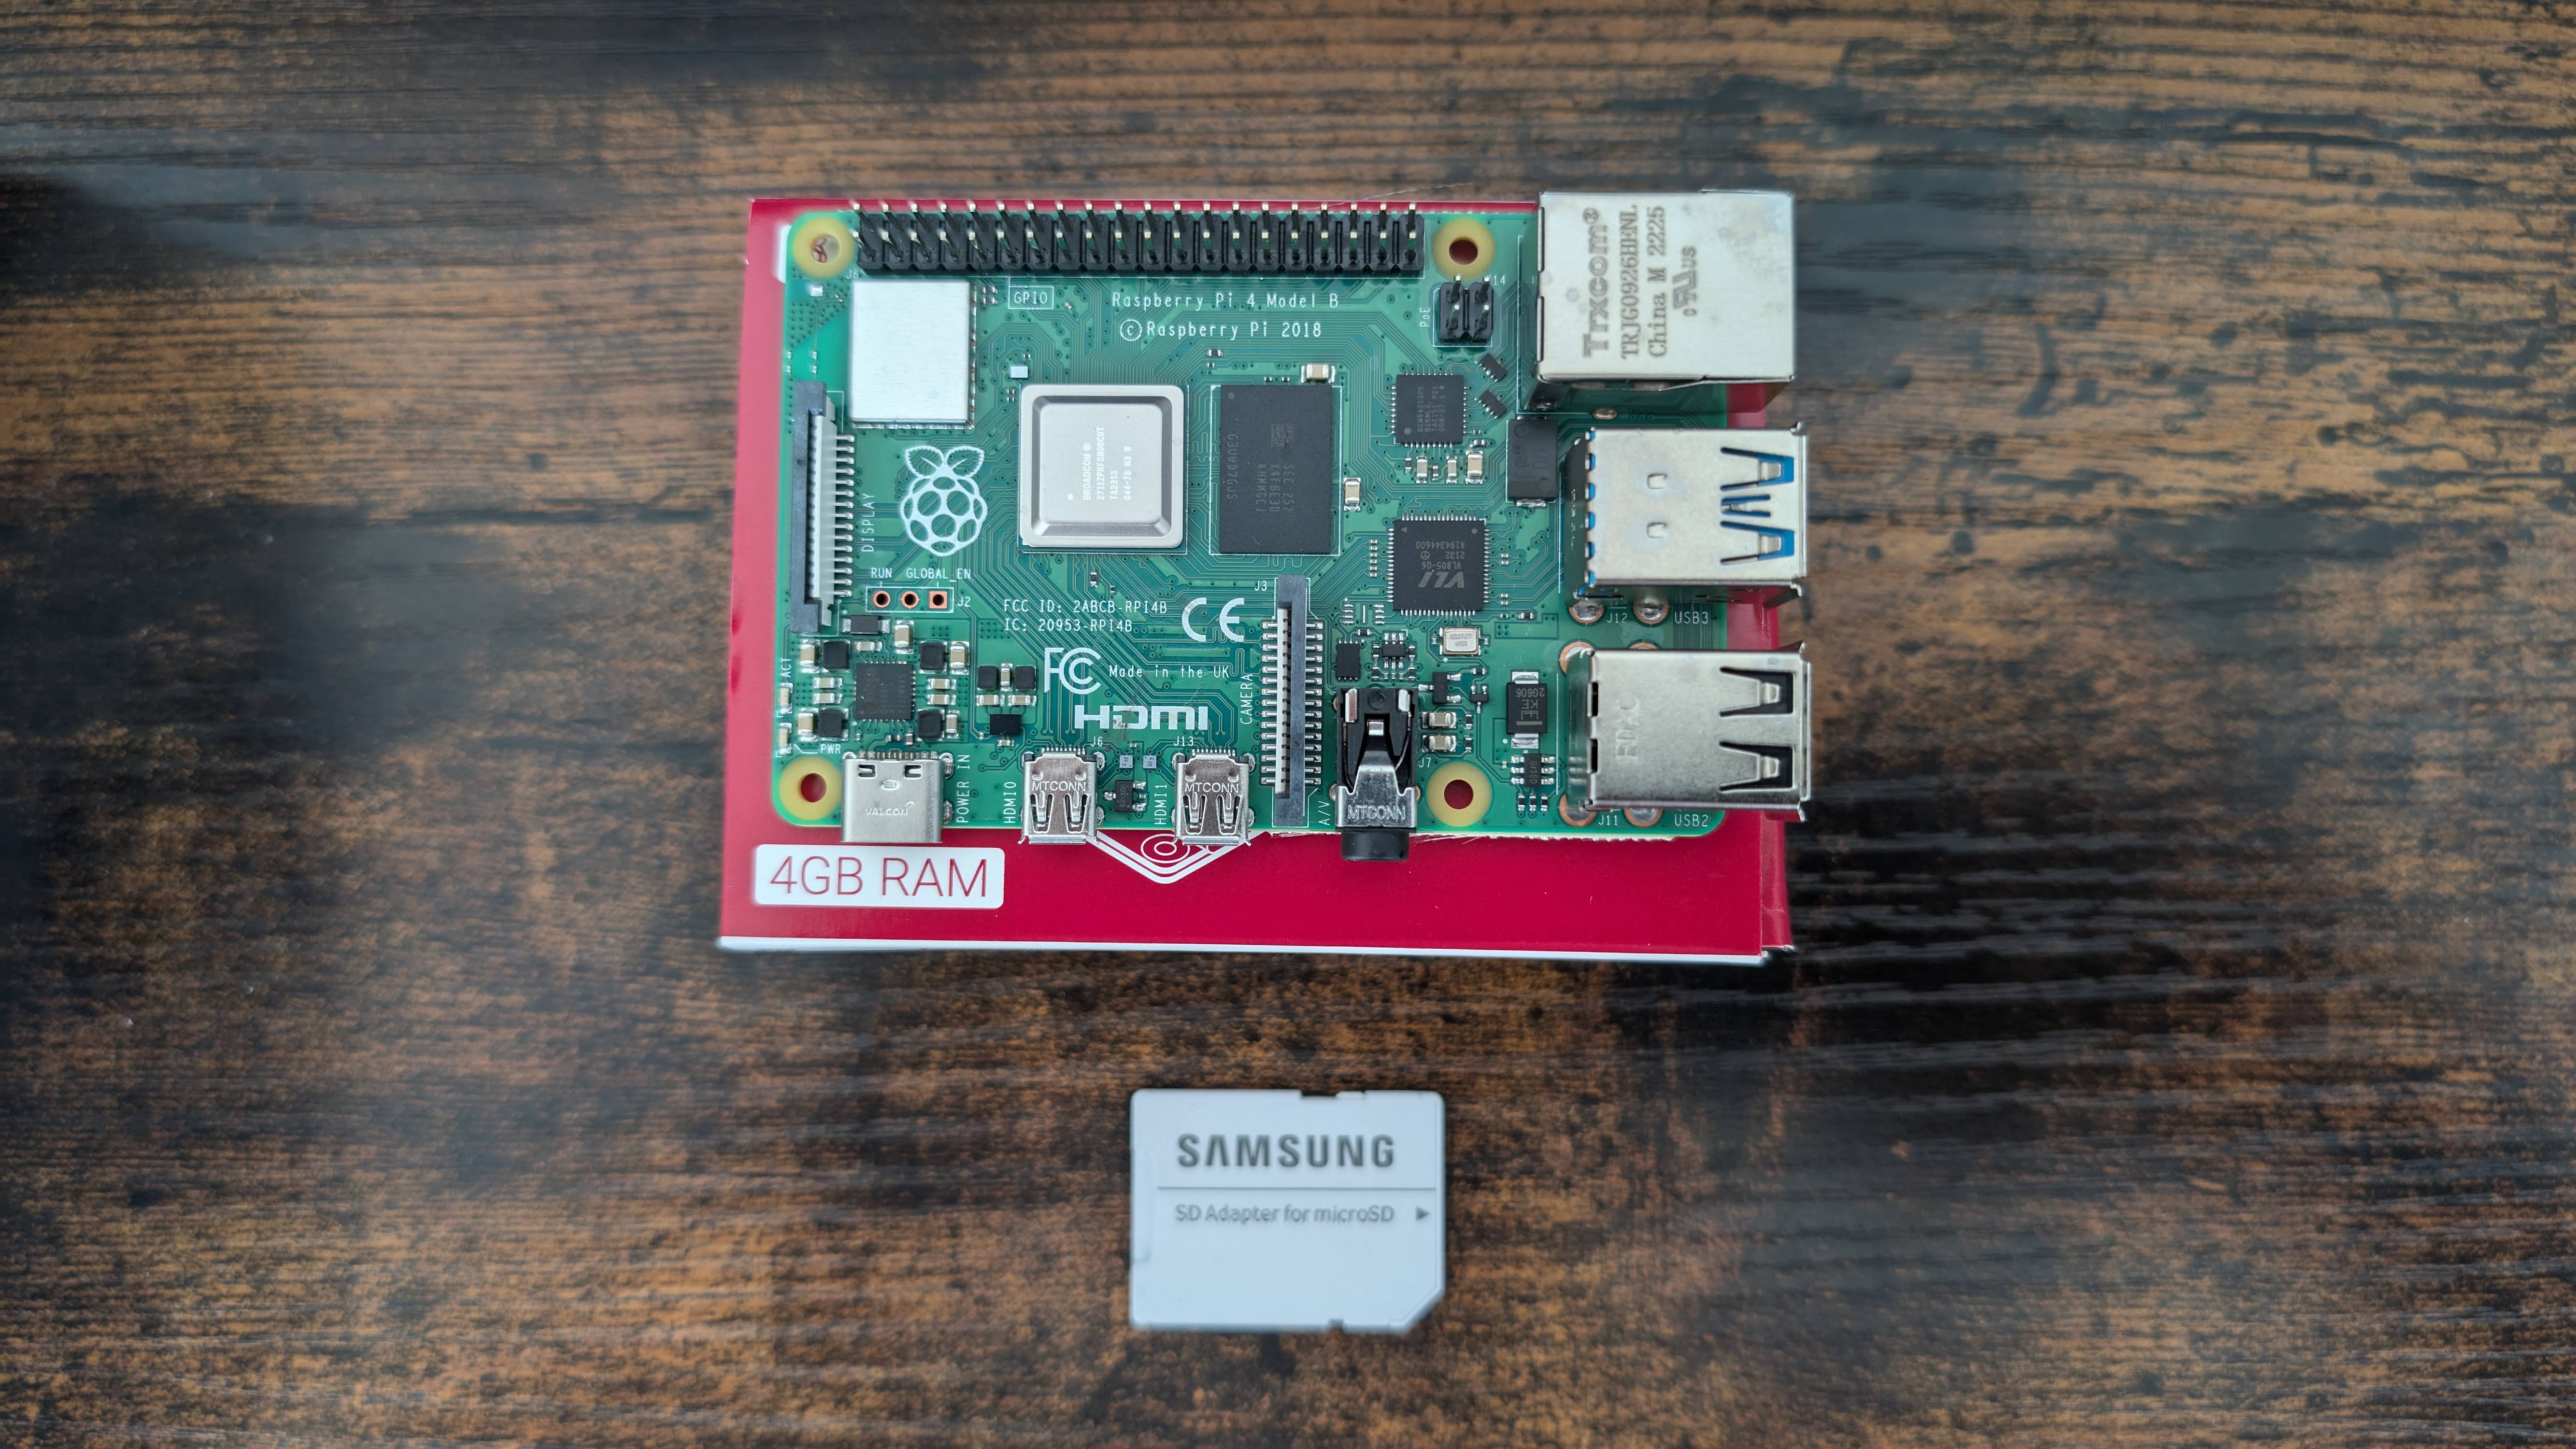
IoT Projec tith Metabase
SelfHost These BI Tools with Docker
Compare with Apache Superset - https://superset.apache.org/
You can use serverless version of it at - https://preset.io/
Metabase Embedded Analytics
See https://www.metabase.com/product/embedded-analytics
node.js ruby python…
Static Embedding
Metabase with MariaDB
- https://www.metabase.com/data_sources/mariadb
- https://www.metabase.com/docs/latest/databases/connections/mariadb
Superset
Apache Superset: https://github.com/JAlcocerT/Docker/tree/main/IoT/Superset
Get Superset running locally with docker-compose.
Conclusions
Metabase/superset/redash - Can also represent GPX data
Many analytics tools to choose from:
Additional Databases and Tools:
- MongoDB
- Elasticsearch (ES)
- InfluxDB
- Graphite
- OPENFoam
Whatever BI technology you are using, make sure to understand how it adds values to the final users.
Why a Project Charter? 📌
Imagine you’re planning a big trip with your friends.
Before you pack your bags and hit the road, you’d probably want to agree on a few key things, right?
A project charter is like that agreement for a project at work or school.
In simple terms, it’s a short, important document that clearly says:
- What exactly are we trying to achieve with this project? (The goal)
- Why are we doing this project? (The reason and benefits)
- Who are the main people involved? (The key players)
- What are the main things we need to do? (The high-level plan)
- What are the big limits or rules we need to follow? (Like budget or deadlines)
- Who has the authority to say “yes, let’s do this”? (The person who approves the project)
Think of it as the project’s “birth certificate” and “permission slip.”
It makes sure everyone is on the same page from the very beginning and knows what the project is all about before a lot of time and effort is spent.
- Project purpose: Why is this project important, and what business need does it fulfill?
- Project objectives: What do you want to achieve by the end of your project, and what metrics will you use to measure project success?
- Project scope and deliverables: What specific deliverables will you complete, and what will you NOT work on?
- Required resources or project needs: What do you need to complete this work? This includes people, tools, and budget.
- Project stakeholders: Who are your project team members? Who needs to approve the project charter, who’s the project sponsor, and who should be looped into key decisions?
Without a project charter, it’s like going on that trip without knowing where you’re going, who’s paying, or when you need to be back – it can get messy quickly!
Syncing Expectations
During Requirements Gathering:
- What are the most important KPIs or metrics that the data product should track and display? This is fundamental to understanding the purpose and value of the data product. It directly informs what data needs to be sourced, transformed, and presented.
- How will the data product integrate with existing BI tools or platforms within the organization? This addresses the usability and adoption of the new product. Avoiding siloed tools and ensuring seamless integration is key for user acceptance and efficiency.
- What are the data governance and security requirements for this project? This is critical for compliance, trust, and mitigating risks. Understanding data sensitivity, access controls, and governance policies early on prevents costly rework later.
- What level of interactivity and customization is expected in the data product (e.g., dashboards, reports)? This defines the user experience and the technical complexity of the solution. Understanding these expectations early guides design and development choices.
- What are the key objectives (OKR) and goals of this data product or project? This establishes the strategic alignment and desired outcomes. These goals will be the yardstick for measuring the project’s success.
- Who are the primary end-users or target audience for this data product? Understanding the audience is crucial for tailoring the data, visualizations, and overall user experience to their specific needs and technical proficiency.
- What specific data sources and datasets will be used for this project? This is a foundational question for technical feasibility and data availability. Identifying data sources early helps assess data quality, accessibility, and the need for data integration efforts.
- Are there any preferred data visualization tools or techniques for this data product? This can be driven by organizational standards, user familiarity, or specific analytical needs. Knowing these preferences early can streamline development.
- What are the expected timelines or milestones for this project? Understanding the time constraints is essential for project planning, resource allocation, and managing stakeholder expectations.
- How does this data product align with the organization’s overall data strategy and objectives? This ensures the project contributes to the broader data vision of the organization and avoids creating isolated solutions.
- Are there any known pain points or challenges in the organization’s data landscape that this data product should address? This helps frame the project as a solution to existing problems, increasing its relevance and potential impact.
- What specific tools, technologies, or platforms should be used for this project, and do they align with the organization’s existing infrastructure? This addresses technical feasibility, cost efficiency, and maintainability. Leveraging existing infrastructure can reduce complexity and costs.
- What is the scope for collaboration and communication between different teams (e.g., data, IT, business) during this project? Defining communication channels and collaboration expectations early is crucial for smooth project execution and stakeholder alignment.
When Creating the Project Charter:
These questions directly inform the key sections of a project charter:
- Project Objectives and Goals: Directly addressed by “What are the key objectives (OKR) and goals…?”
- Project Scope: Defined by “What specific data sources…”, “What level of interactivity…”, and “What specific tools…?”
- Key Stakeholders: Identified by “Who are the primary end-users…?” and “What is the scope for collaboration…?”
- High-Level Requirements: Summarized from the answers to questions about KPIs, integration, governance, visualization, and alignment with data strategy.
- Project Deliverables: Implicitly defined by the expected functionality and outputs of the data product.
- High-Level Timelines and Milestones: Directly addressed by “What are the expected timelines…?”
- Assumptions and Constraints: Informed by the existing BI tools, data governance requirements, preferred tools, and infrastructure alignment.
- Success Criteria: Directly linked to the “most important KPIs or metrics” and the “key objectives and goals.”
These are not just good questions; they are essential questions for laying a strong foundation for a data product project.
Addressing them thoroughly during requirements gathering will significantly contribute to a well-defined and effective project charter, ultimately increasing the likelihood of project success.
FAQ
More BI Tools
Latitude is an open-source framework created to simplify embedded analytics by providing a powerful analytics layer between databases and end-users.
It allows developers to integrate data analytics into applications efficiently without requiring deep expertise in database management or visualization.
Among other DBs, latitude works with SQLite!
Key Features:
- Database Connectivity: Latitude can connect to a variety of databases and data warehouses, providing flexibility for different environments and data sources.
- Parameterized SQL Queries as API Endpoints: It allows users to create parameterized SQL queries and expose them as API endpoints, making it easy to query data dynamically and integrate with other systems.
- Interactive Visualizations: Latitude supports interactive data visualizations in front-end frameworks (such as React, Svelte, and Vue), or alternatively, it can display them within iframes for easy embedding in web pages.
- Caching for Performance: The framework includes built-in caching, which optimizes query performance and reduces the load on databases by storing previously queried results.
- Security: Latitude is SSL-ready and includes protections against SQL injection, ensuring secure communication between the client and the database.
- Community-driven: The project encourages contributions from developers, fostering an active open-source community.
Use Cases:
- Quick Dashboard Creation: Developers can rapidly build dashboards and visualizations, allowing end-users to explore and interact with data without extensive custom development.
- Single-command Deployment: Latitude can be deployed quickly with a single command, making it easier for developers to get up and running without complex configurations.
- Framework Integration: Latitude integrates seamlessly with popular front-end frameworks like React, Svelte, and Vue, which are commonly used for building modern web applications.
Current Status:
- The project is no longer maintained as the focus has shifted to a new project, Latitude LLM, which likely focuses on new features or different capabilities.
- Existing users can still use the codebase and license as-is, though no new updates are being released.
Latitude simplifies the integration of embedded analytics for developers, allowing for easy creation and deployment of dashboards, visualizations, and queries.
Its simplicity and integration with modern front-end frameworks make it a valuable tool for building analytics-rich applications.
Similar projects to Latitude include:
- Superset: An open-source data visualization tool that allows users to create and share dashboards.
- Metabase: Another open-source analytics platform that focuses on simple setup and user-friendly dashboards.