PyStonks v1
Tl;DR
Creating a py_stocks v2.0, or a py_stonks v1.0
Got working streamlit + PB auth as per these scripts 🐍.
Also a cool FastAPi + Firebase Auth (that works on desktops and not really on phones)
And a comparison of Flask Plotly vs FastAPi with ChartJS
+++ Got to know few very logical concepts, like the drawdown (MDD). +++ Plus the cool ipynb for animations…
Intro
Some people tell you to make a business.
Other to become a crypto bro.
Others, to place ads in your website or install strange apps that gives you money without you knowing how.
#docker run honeygain/honeygain -tou-accept -email ACCOUNT_EMAIL -pass ACCOUNT_PASSWORD -device DEVICE_NAME

#version: '3'
#services:
#  honeygain:
#    image: honeygain/honeygain #https://hub.docker.com/r/honeygain/honeygain
#    command: -tou-accept -email ACCOUNT_EMAIL -pass ACCOUNT_PASSWORD -device DEVICE_NAME
And today, we are going to have fun with stonks.
Kind of a recap of yfinance, ipynb, matplotlib animations… and Python Web Apps for this year.
After having abandoned Py_Stocks on the state written on this post.
Earlier this year Ive tinkered with this 2 stock related web apps:
Reflex looks really cool in phones as well, but still I was more confortable with streamlit logic.
Auth was still…kind of a mistery then.
Now, with Py_Stonks i want to put together all the Python Web App and back-end stuff Ive learnt this summer.
And create a kind of blueprint for secure web apps with few authentication methods: at least as of my knowledge in sept2025.
Im just taking ideas from these 2 + combining them with auth stuff Ive learnt in the meantime.
 Streamlit PoCData In Motion Repo
The Stonks Stack
What’s going to be different this time?
- To have
.ipynbon the EDA showing how to use yfinance.
Im tired to have to ask LLMs each time
A better Back-End
Auth via Logto JS SDK (instead of the Logto Pyhon SDK)
Starting The Stonks Project
git init
git branch -m main
git config user.name
git config --global user.name "JAlcocerT"
git config --global user.name
git add .
git commit -m "Initial commit: YFinance stock analysis project"

#sudo apt install gh
gh auth login
gh repo create py-stonks --private --source=. --remote=origin --push
How could I not get started with .ipynb and a venv for a quick EDA.
EDA on YFinance
Its not been the first time to tinker with yfinance, but now is the first time ive done so via windsurf and claude 4.
I created some yfinance-10*.ipynb files to make sure I dont need to go back and see how to pull prices and dividends from the API.
And with one prompts I was gettings this: via yfinance-104.ipynb available here
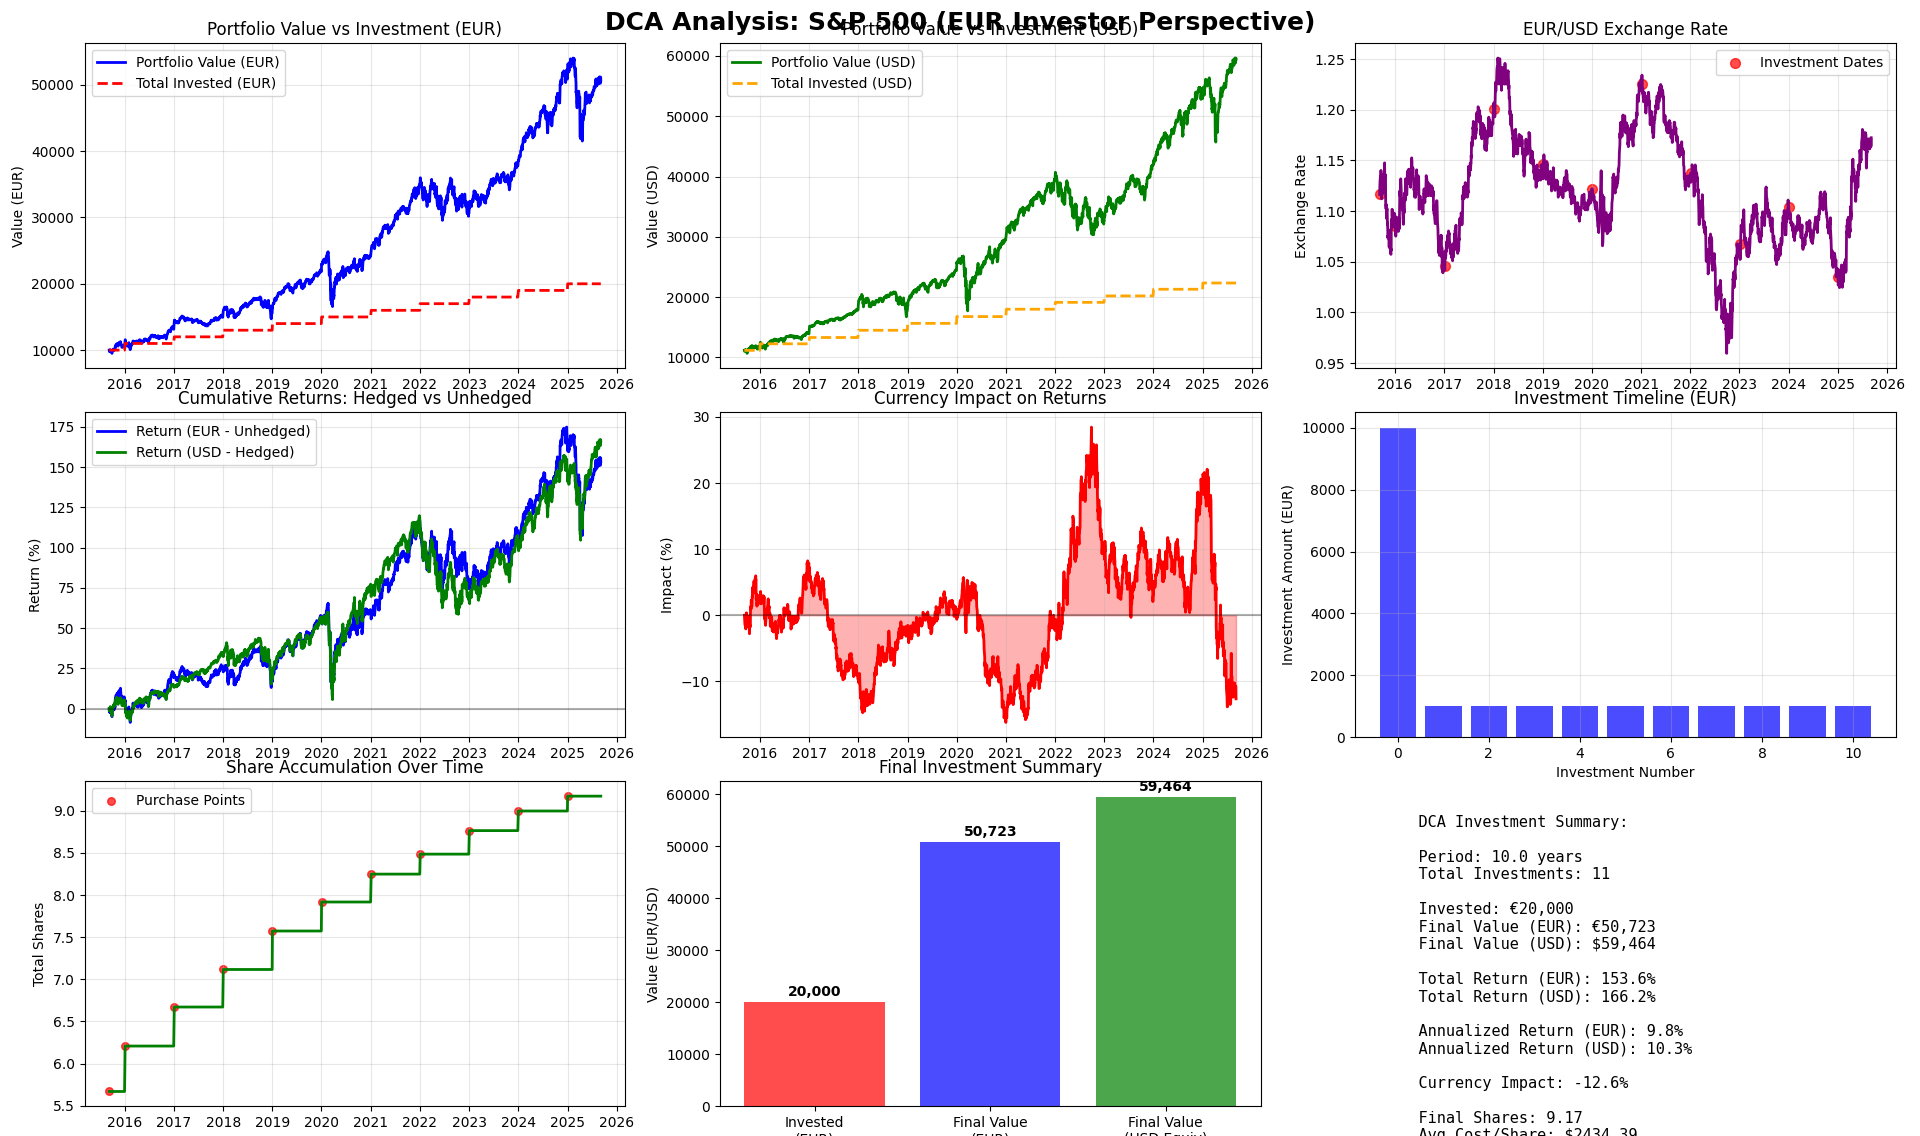
Isnt it cool to share on forums?
Then quickly after put this HLD of the architecture via mermaid
Claude recommended me to bring also Alpha Vantage API
About Alpha Vantage API for financial Data📌
Free Tier
- 5 API calls per minute
- 500 API calls per day
- No credit card required
- Access to most basic data types
Paid Plans
- $25/month: 75 calls/minute, 75,000 calls/month
- $50/month: 150 calls/minute, 150,000 calls/month
- $150/month: 300 calls/minute, 300,000 calls/month
- $600/month: 1,200 calls/minute, 1,200,000 calls/month
Yahoo Finance (yfinance)
- Completely FREE
- No API key required
- No rate limits (reasonable usage)
- Unofficial but widely used
Recommendation for Your Project
Start with Yahoo Finance only because:
- Zero Cost: No API fees or registration needed
- Sufficient Data: Covers most stock analysis needs (OHLCV, basic fundamentals)
- Easy Setup: Already implemented in your
data-gatheringmodule - No Rate Limits: For typical portfolio analysis usage
Add Alpha Vantage later if you need:
- More than 500 API calls per day
- Specific fundamental data not in Yahoo Finance
- Economic indicators (GDP, inflation, etc.)
- Higher reliability guarantees
I wanted to keep it simple for now and continued with YFinance only
YFinance Tricks
Typical indexes are called like ^GSPC (Sp500).
It’s important to note that there are two main Nasdaq indices:
Nasdaq Composite
^IXIC: This is the most well-known Nasdaq index. It includes all stocks listed on the Nasdaq stock market, which number over 3,000.Nasdaq 100
^NDX: This index tracks the 100 largest non-financial companies listed on the Nasdaq. It’s often used as a benchmark for technology and growth-oriented stocks.
Data Processing and Storage
I wanted to start building something simple.
But realiable.
So have separated the logic for:
- Data adquisition from yfinance:
./data-gathering - The data processing to cleanup etc
./data-processing - The data storage: that it could have been csv or google sheets…but as im planning to move closer to PB, I started directly with .sqlite
Data Storage in sqlite
#sudo apt install sqlite3
#sqlite3 --version
cd data-storage
sqlite3 ./stock_cache.db

#.tables
SELECT name FROM sqlite_master WHERE type='table';
#.quit #when you are done!
See also how cool your sqlite DB looks: You can use Ui Tools with DBs
# Watch database size grow
ls -lh stock_cache.db
# See all stock tables after running the app
sqlite3 stock_cache.db "SELECT name FROM sqlite_master WHERE name LIKE 'stock_data_%';"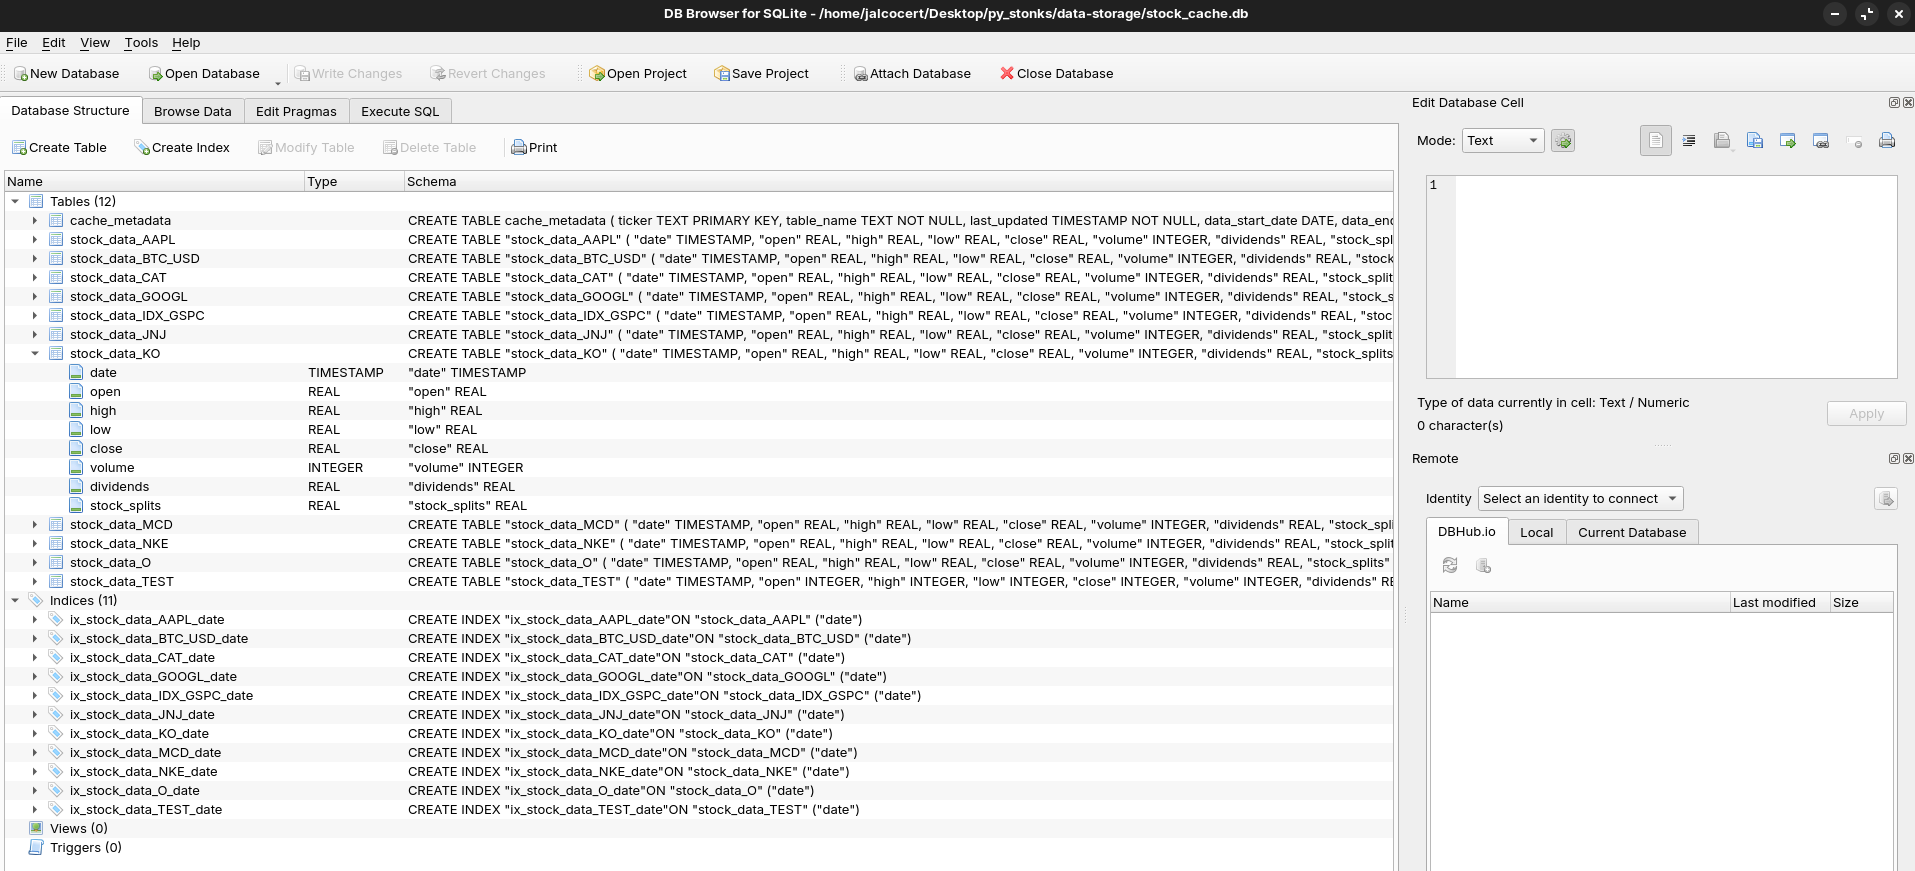
Explore your sqlite with these DB tools 📌
#query directly to the stock_cache.db object one you selected it from the UI
SELECT name FROM sqlite_master WHERE name LIKE 'stock_data_%';
SELECT * from stock_data_KO;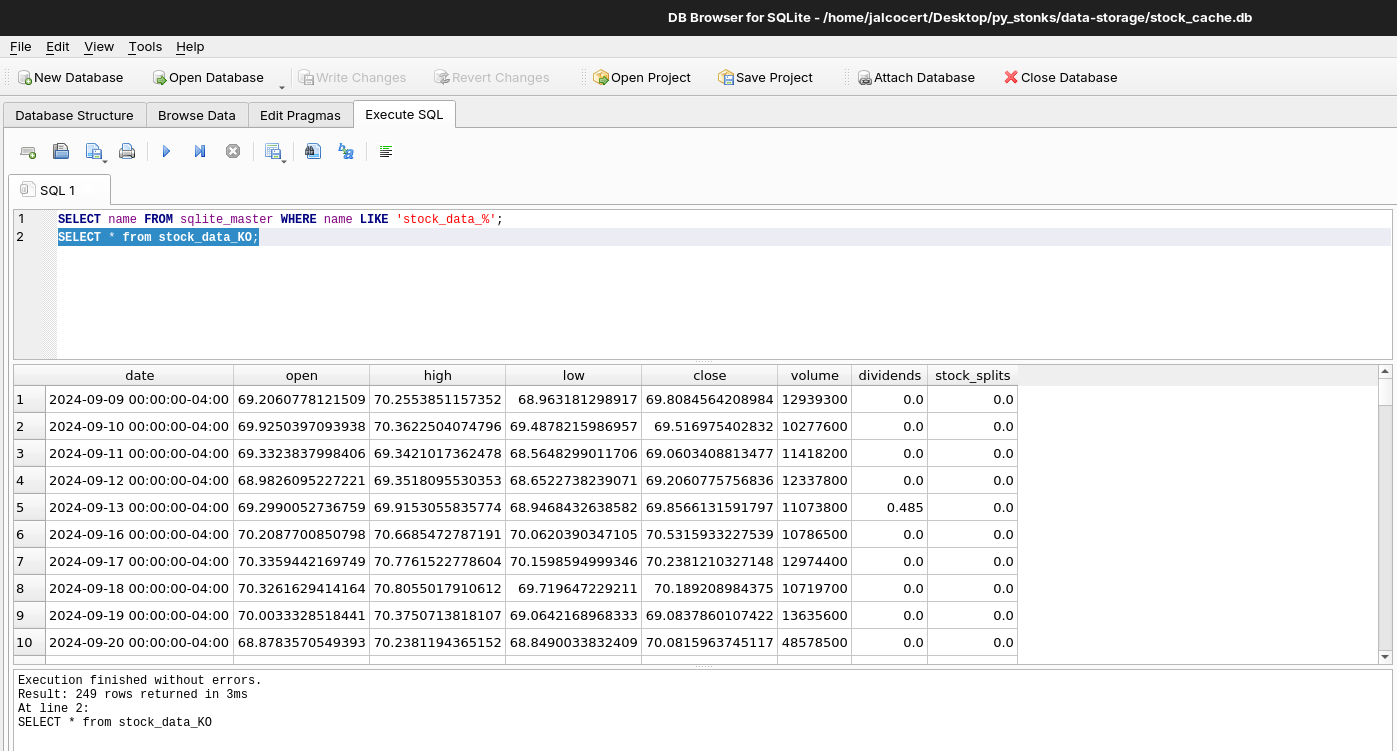
Storing data to Sqlite…DONE ✅
Streamlit
Because im comfortable with streamlit for quick POCs and test the graphs layout / data structure.
In general, with streamlit you can quickly see if the data adquisition, processing and storage/retrieval from the DB is working or not.
uv init
#uv add -r requirements.txt
uv add streamlit-authenticator==0.1.5

uv sync
#uv export --no-hashes --format requirements-txt > requirements.txt
#uv pip freeze > requirements.txt
#uv export --no-hashes --no-header --no-annotate --no-dev --format requirements.txt > requirements-dev.txt
Im still impressed on how well uv works for python dependency management: https://github.com/astral-sh/uv/releases
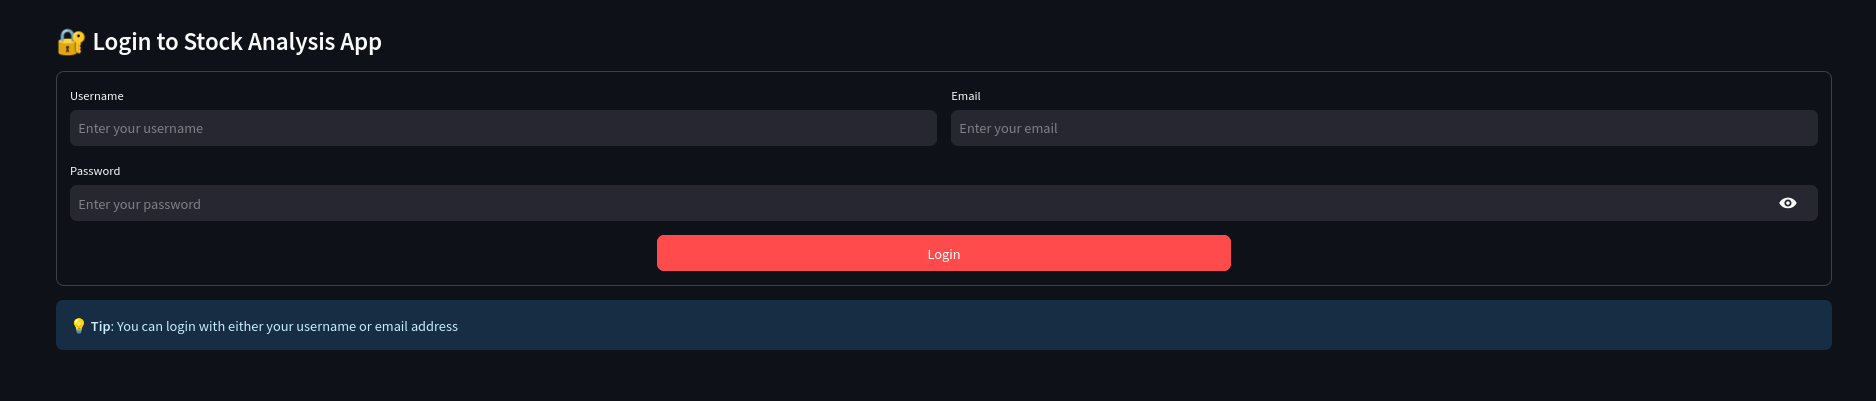
And how could I not bring my good old st auth
Only that I have improved this stack a little bit in two ways: via compose and via PB
uv run streamlit run app-st.py And I can see that the sqlite start to contain records: even inside the container
make streamlit-up
#docker compose -f docker-compose.st.yml logs -f --tail=20
docker exec -it pystonks-app-streamlit sh
sqlite3 ./data-storagestock_cache.db "SELECT name FROM sqlite_master WHERE name LIKE 'stock_data_%';"
For the old hardcoded streamlit auth to look at the container for users allowed, I had to:
export STREAMLIT_AUTH_ENABLED='true'
#by default it uses my favourite yosua/cerdo if anything else provided as per env variable
uv run streamlit run app-st.py
And as I was so close…I could not resist to combine the good old streamlit auth script with the PocketBase users collection:
#export STREAMLIT_AUTH_ENABLED='true'
# Set PocketBase URL (optional, defaults to your URL)
export POCKETBASE_URL="https://pocketbase.jalcocertech.com"

# Run the app
uv run streamlit run app-st.py #the app-st.py is the streamlit version
Wait…
Is this streamlit authentication working with the users of the pocketbase collection?
With a minor tweak…
It can also register new mail/passwords to your PB users collection:
streamlit login/signup as per pocketbase collection DONE ✅
There is a video for your with the result.
Say thanks to this cutie.
from st_auth_pb import loginexport STREAMLIT_REGISTRATION_ENABLED="true" # Enable signup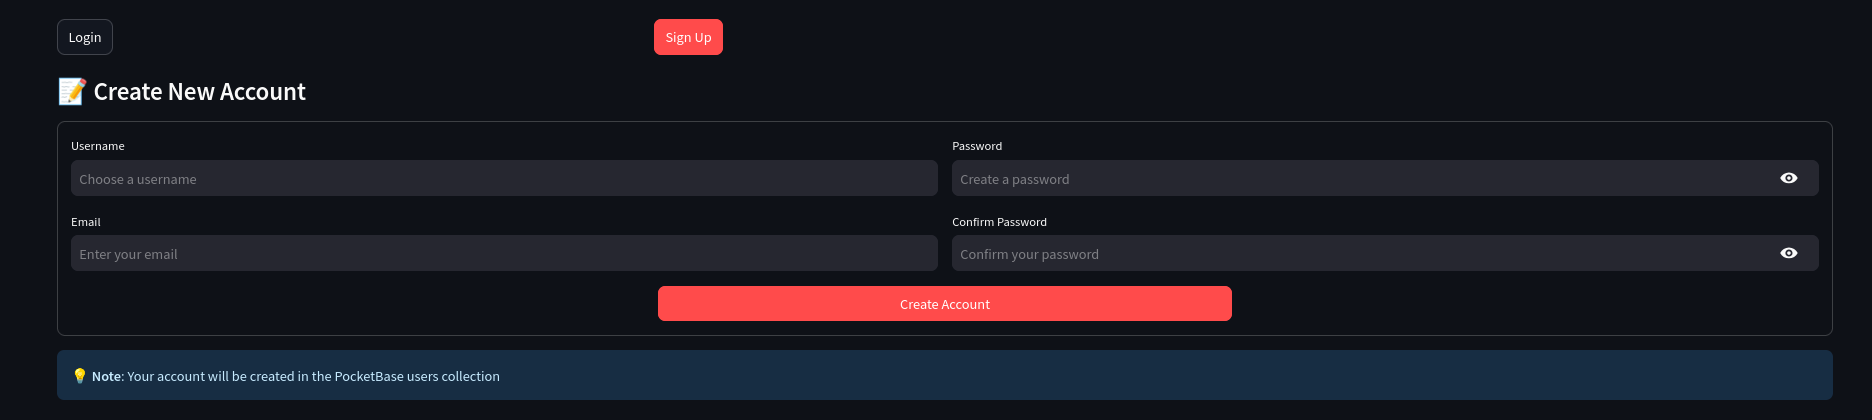
Which they get published into the PB and you get logged in directly.
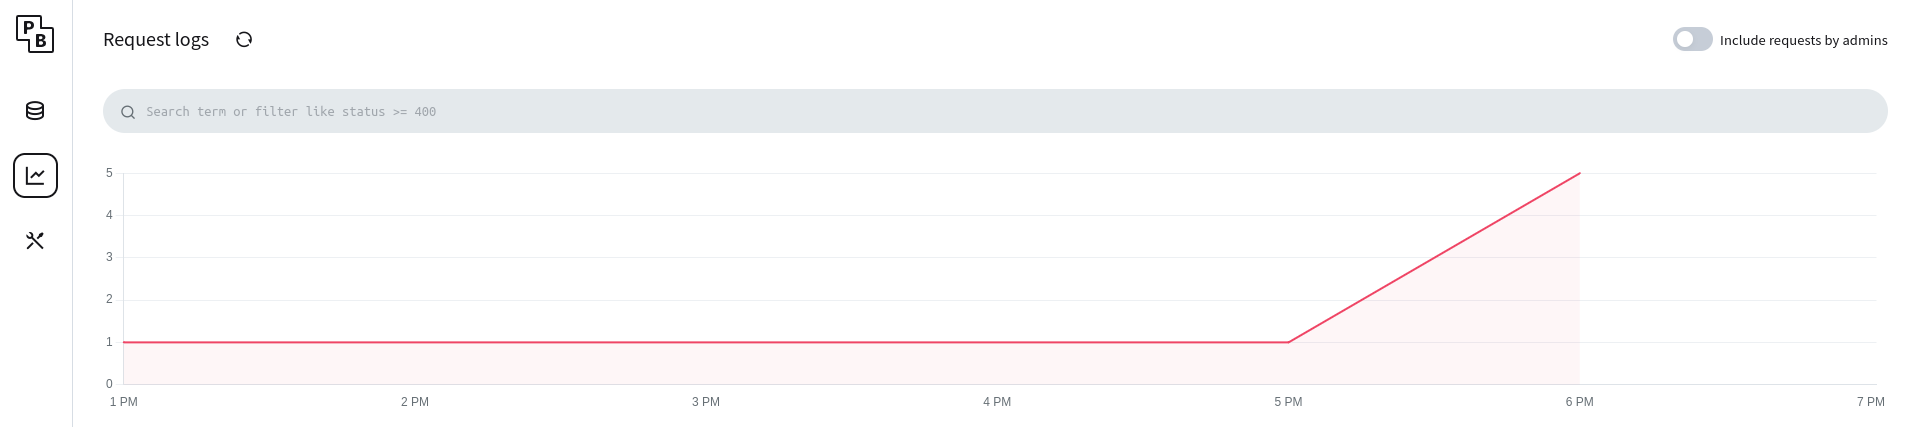
This is MAGIC. See
http://192.168.1.11:8080/_/#/logs
Flask
The hardcoded Flask auth via compose, I was already testing it as per this script when playing with FlaskCMS on this post.
But no im not doing something from scratch.
Im leveraging:
- The way yfinance works as per the EDA above
- Streamlit is my go to for a quick UI for web apps and data presentation layer
#lsof -ti:5000 | xargs kill -9
uv run python app-flask.py  # Already running at port 5000
So it was pretty straight forward to arrive to this:
Key Insights 💡
For any time doing Streamlit -> Flask you can find on this .md
Why This Migration is Easy
Separation of concerns - UI vs business logic
Framework-agnostic data layer - SQLite works everywhere
Modular architecture - Independent data processing
Consistent patterns - Same import structure
Lessons for Future Migrations
- Keep business logic separate from UI frameworks
- Use database abstraction for easy backend switching
- Design for reusability from the start
- Document shared components clearly
Conclusions
And with all this…a Data Driven eBook?
This is something to consider.
Specially after having some thoughts placed on ebook as a code post.
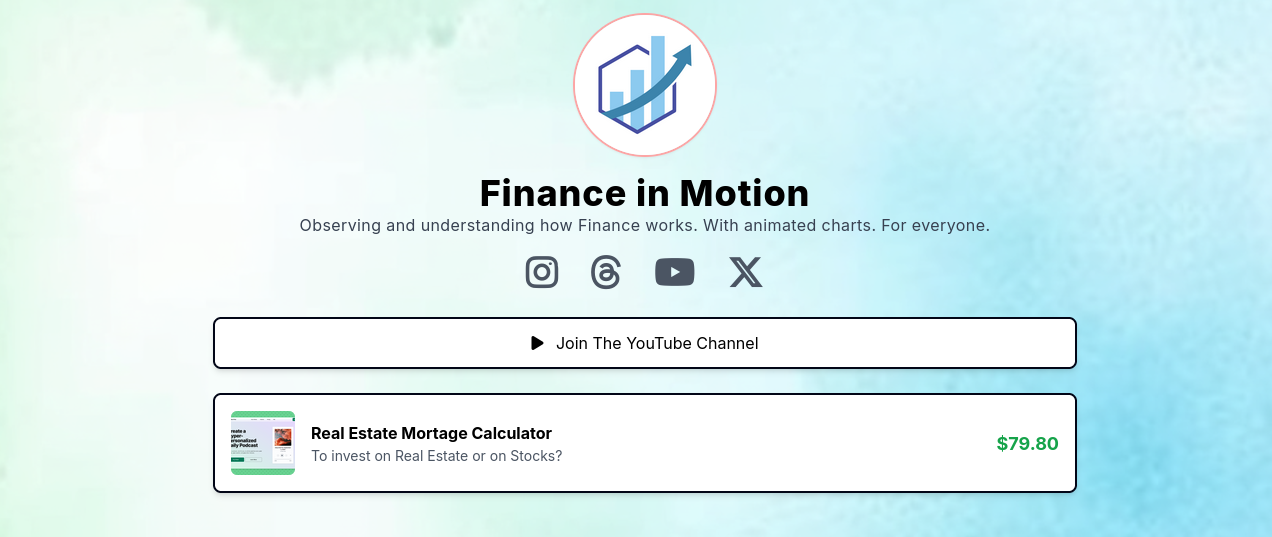
You dont need much more than this for a OHLC and trends info: https://app.financeinmotion.fyi/
- Bring the streamlit + pocketbase version up in your server and expose via CF tunnels:
git clone https://github.com/JAlcocerT/py-stonks
make streamlit-up
#docker network connect cloudflared_tunnel pystonks-app-streamlit #network -> container name
docker inspect pystonks-app-streamlit --format '{{json .NetworkSettings.Networks}}' | jq #publish it via Zero Trust with pystonks-app-streamlit:8501Animations as they should have been (simple)
For the future - ebooks stuff
Static where possible, CSR for cool free stuff functionality, SSR via streamlit/flask/fastapi for whatever more
FastAPI x PyStonks Sqlite
How about exposing the pulled data into some REST endpoints?
Because FastAPI is one of those Python BE fwks that you will find out to be very useful.
If you are a Data Engineer, you can service data via FastAPI! 📌
FastAPI and data engineering are related because FastAPI is a popular Python framework used to build APIs (Application Programming Interfaces) that serve data and machine learning models.
In a data engineering context, FastAPI can be used for several key tasks:
- Serving Data: It can be used to create REST APIs that allow other applications or front-ends to access processed and cleaned data from a data warehouse or database.
- ETL Pipelines: FastAPI can be the “Extract” part of an ETL (Extract, Transform, Load) pipeline, where it fetches data from external APIs. It can also act as the final “Load” step, where it provides an endpoint for data to be ingested.
- Deployment of Models: Data engineers and data scientists use FastAPI to wrap machine learning models in an API, making them accessible for real-time predictions in production environments.
In a data pipeline, FastAPI often sits at the end, acting as the service layer that makes the processed data available for consumption.
FastAPI and Frontend
FastAPI is a backend framework, meaning its primary purpose is to handle the server-side logic, data processing, and API creation. It does not directly handle the frontend, which is the user-facing part of an application (e.g., HTML, CSS, JavaScript).
The relationship is that a frontend, built with frameworks like React, Angular, or Vue.js, communicates with the backend APIs created by FastAPI.
The frontend sends requests to the FastAPI backend, and the backend responds with data (usually in JSON format) that the frontend then uses to display information to the user. This is a common client-server architecture.
FastAPI, running on the backend, processes data (from a database, another API, a file, etc.) and exposes an API endpoint. When a frontend application, like one built with Vue.js, makes a request to that endpoint, FastAPI sends back the data, typically in JSON format.
Vue.js, running on the user’s browser, receives this JSON data. It then uses a charting library (like Chart.js or ApexCharts) to parse the date and value fields from the JSON object and render them as a line chart on the user interface.
This interaction exemplifies a common client-server architecture:
- FastAPI is the server (the backend) that provides the data.
- Vue.js is the client (the frontend) that requests and visualizes the data.
Template Engines | FastAPI vs Flask 📌
A template engine is a tool that allows you to combine static HTML templates with dynamic data to generate complete web pages on the server.
It uses placeholders in the HTML files that are filled with real data (e.g., from a database or a variable) before the page is sent to the user’s browser.
This separates the presentation (HTML) from the application logic (Python code).
Does FastAPI have a template engine?
No, FastAPI does not have a built-in template engine. It is primarily an API framework designed to build the backend of an application. It’s meant to handle requests and return data, typically in JSON format, which a frontend (like a React or Vue.js app) then uses to build the user interface.
However, you can easily integrate a template engine into FastAPI. The most common choice is Jinja2, the same one used by Flask. You can add Jinja2 support by installing the python-jinja2 library and using FastAPI’s Jinja2Templates class. This allows you to render HTML pages on the server, although for most projects, FastAPI is still best used for serving data via an API.
Does Flask have a template engine?
Yes, Flask has a built-in template engine, which is Jinja2. This is one of the key differences between Flask and FastAPI. When you install Flask, Jinja2 is included by default. Flask provides a render_template() function that makes it easy to pass data to a template and render the final HTML page. This makes Flask well-suited for building traditional, server-side rendered websites where the backend is responsible for generating the entire HTML page before sending it to the user.
#uv add fastapi uvicorn
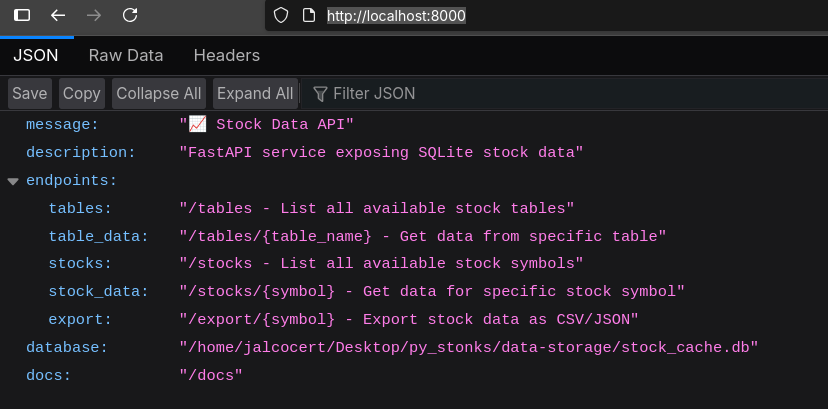
uv run app-fastapi.pyGo to
http://localhost:8000/
And if you have that port busy with portainer…I got you covered:
#First, prepare FastAPI to be able to query the pulled data into sqlite
#!uv run app-fastapi.py
!uv run app-fastapi.py --port=8045
#!uv run app-fastapi.py --auto-port
#!uv run app-fastapi.py --port=9000 --auto-port
All the data comes via FastAPI from these pulled tables:
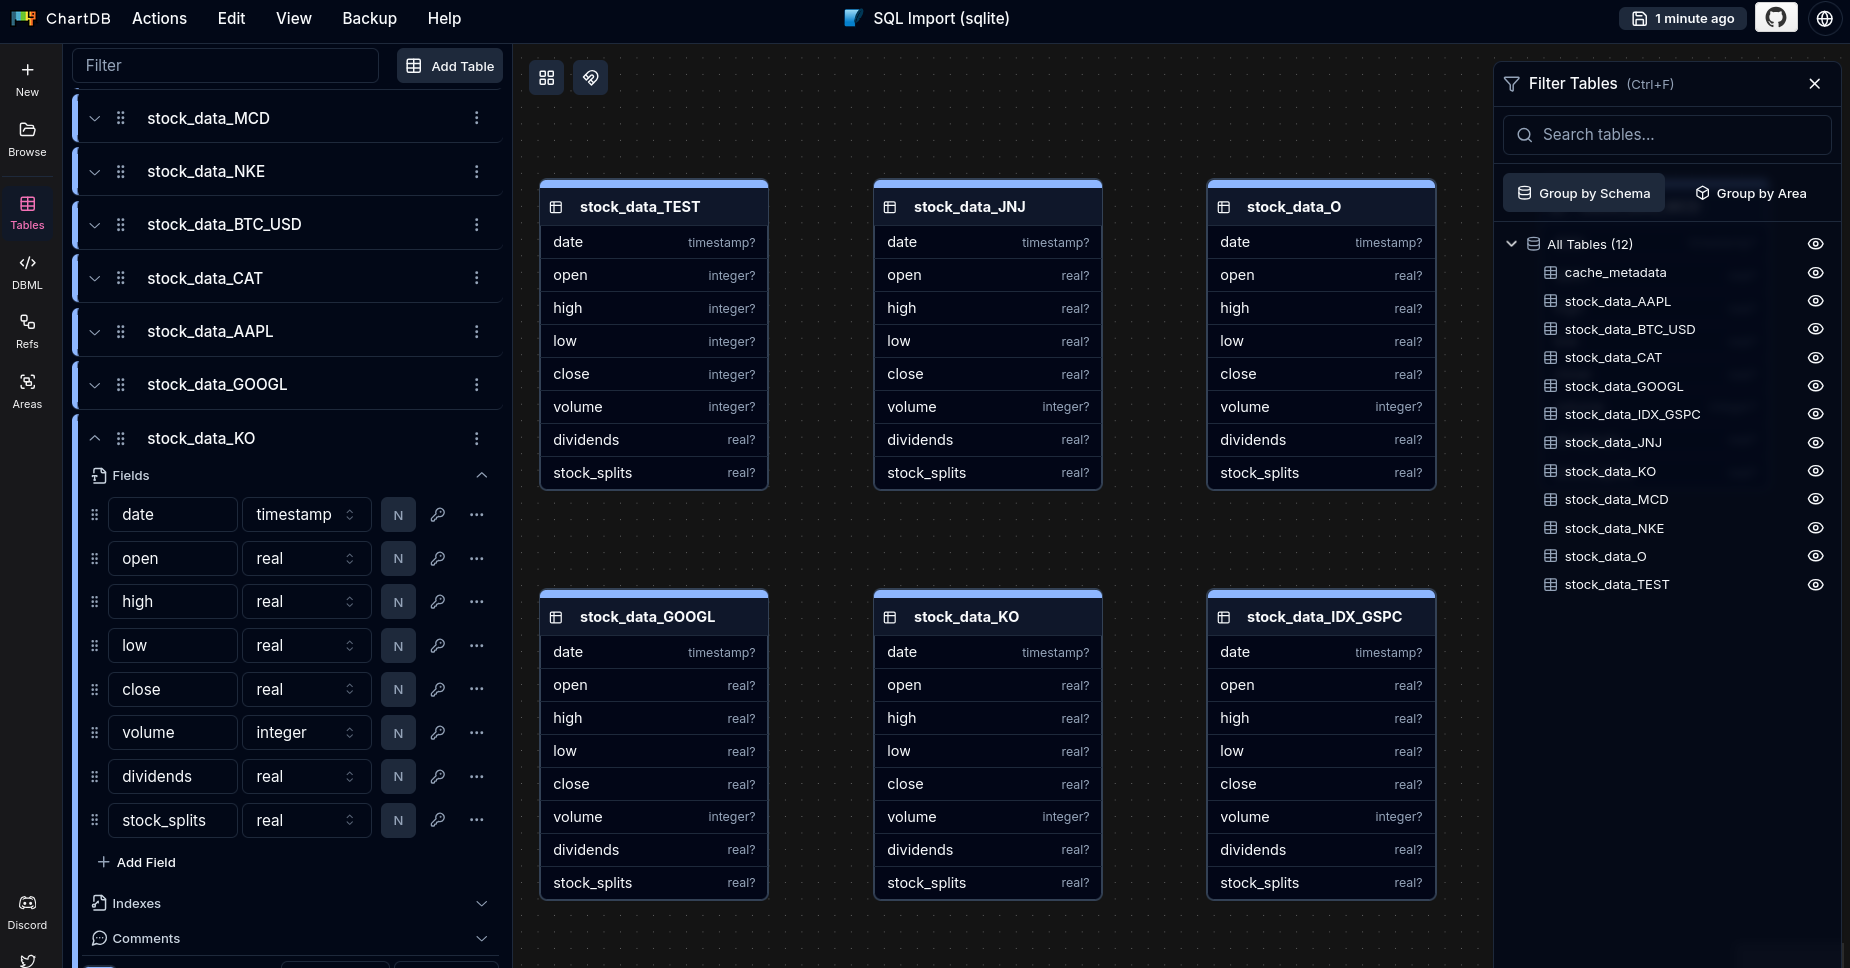
Thanks to FASTAPi, we have a REST API that exposes all your SQLite stock data tables.
🚀 Key Features:
📊 Database Integration
- Connects to your existing
data-storage/stock_cache.db - Exposes all stock data tables (one per ticker as per your caching design)
- Handles cache metadata and statistics
🔗 API Endpoints:
GET /- API overview and endpoint documentationGET /health- Database connection health checkGET /tables- List all SQLite tables with row counts and columnsGET /tables/{table_name}- Query specific table with filteringGET /stocks- List all available stock symbols with date rangesGET /stocks/{symbol}- Get stock data with statisticsGET /export/{symbol}- Export data as JSON or CSVGET /cache/status- Cache database statistics and metadata
🎯 Query Features:
- Date range filtering (
start_date,end_date) - Pagination (
limit,offset) - Format selection (JSON/CSV export)
- Basic statistics (latest close, highs, lows, volume)
📖 Interactive Documentation:
- Swagger UI: http://localhost:8000/docs
- ReDoc: http://localhost:8000/redoc
🔧 Example API Calls:
# List all available stocks
curl http://localhost:8000/stocks

# Get AAPL data (last 50 records)
curl http://localhost:8000/stocks/AAPL?limit=50

# Export KO data as CSV
curl http://localhost:8000/export/KO?format=csv

# Get cache status
curl http://localhost:8000/cache/status
The API perfectly complements your existing SQLite caching system, providing programmatic access to all your cached stock data while maintaining the one-table-per-ticker architecture you implemented.
What’s so cool about it?
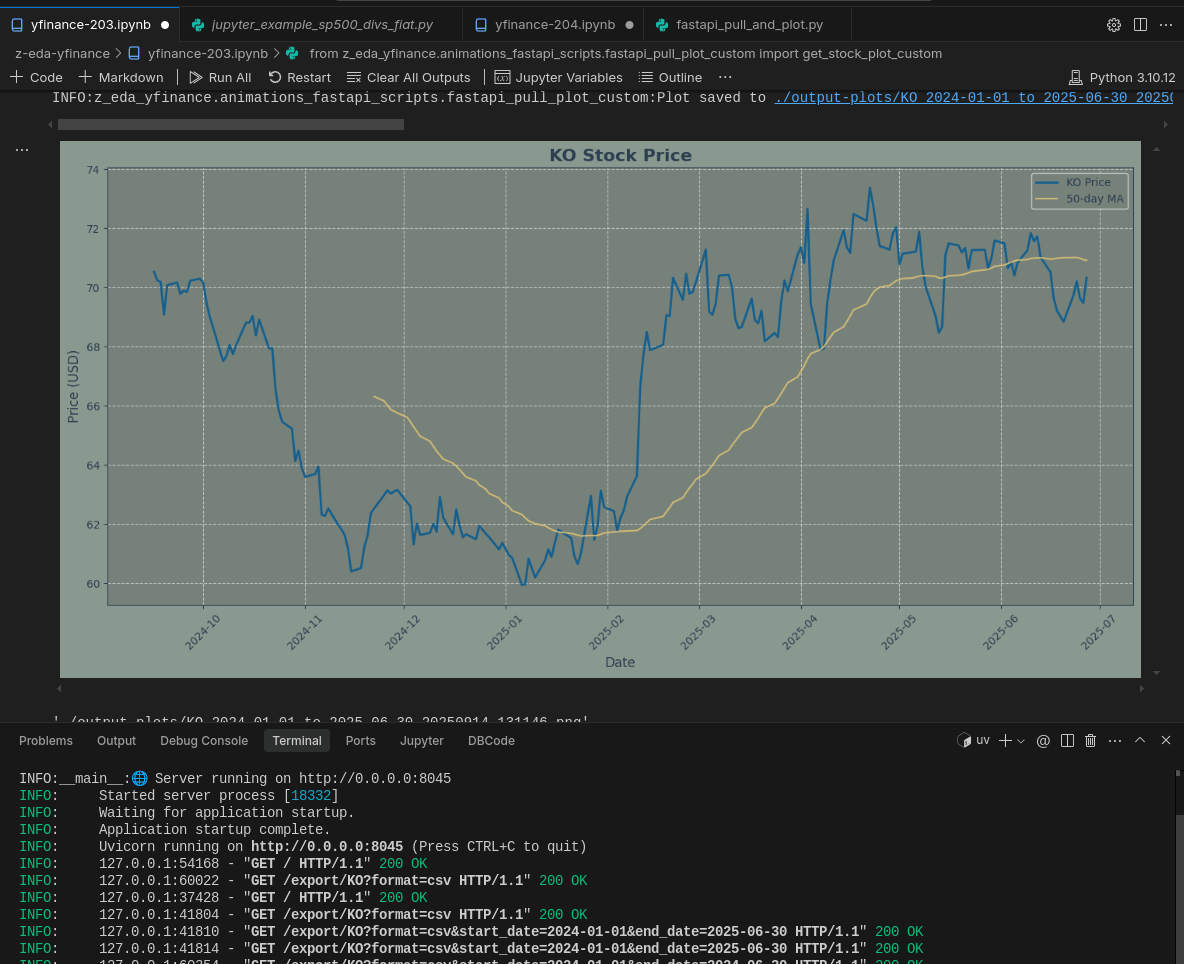
That we can query now the sqlite data via: yfinance-201.ipynb
# Define the URL of your API endpoint
api_url = "http://localhost:8000/export/KO?format=csv"
import pandas as pd
import matplotlib.pyplot as plt


# Read the CSV data directly into a pandas DataFrame
try:
    df = pd.read_csv(api_url)
    print("Data loaded successfully!")
    print(df.head())
except Exception as e:
    print(f"An error occurred: {e}")
    # You might want to handle specific HTTP errors here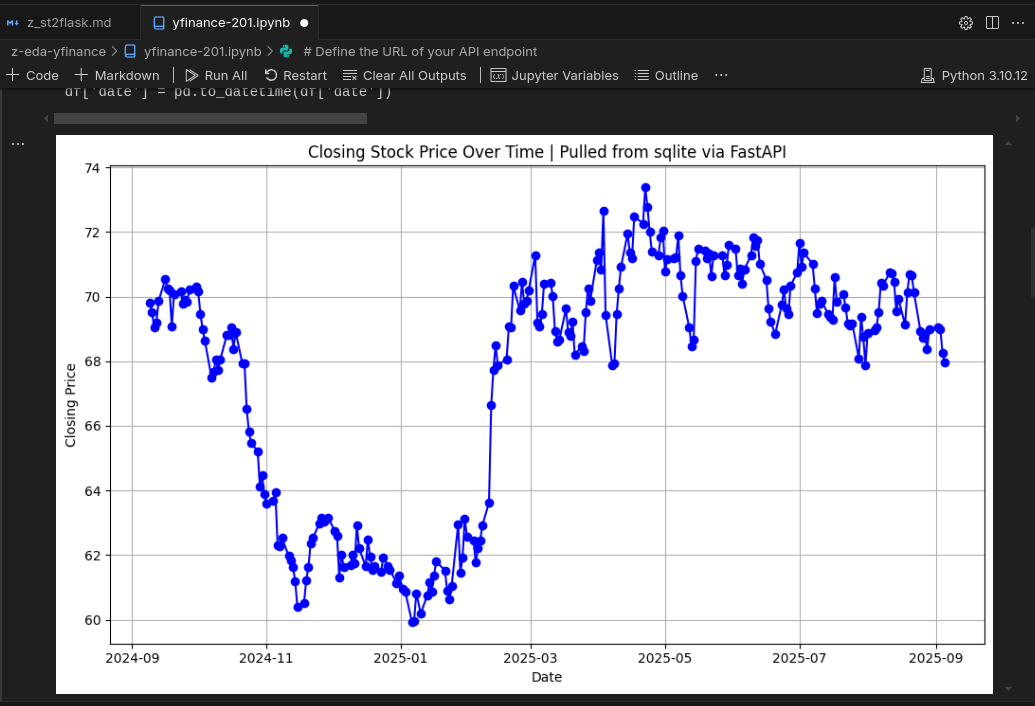
This will now only allow you to get an endpoint, but to use it for your animations
Astro x Data x ChartJS
Earlier this year, I got a domain and played with the Astro Link in Bio Theme.
- https://financeinmotion.fyi/
- If like me, you forgot, go add it to:
https://search.google.com/search-console
So…how about taking that very simple astro SSG, add some calculators that can run via JS on the browser.
Just with CSR, like:
https://calculatoradam.com/monthly-recurring-revenue-calculator/https://www.moneyunder30.com/fire-calculator/https://millennialmoney.com/calculators/fire-calculator/with very interesting CSR powered tableshttps://millennialmoney.com/calculators/
Then, provide proper login/signup/logout with FastAPI and ChartJS/d3js/Plotly/Recharts?
FastAPI x Astro SSG 📌
You absolutely can combine FastAPI with any static site generator (SSG).
The key concept to grasp is that they are two separate parts of your application stack that work together, not one serving as a template engine for the other.
Here’s the fundamental workflow:
Static Site Generation (SSG): You use a static site generator like Astro, Hugo, Jekyll, Next.js (in static export mode), or any other SSG. This tool takes your source files (Markdown, templates, components, etc.) and compiles them into a directory of static assets, which are essentially pre-rendered HTML, CSS, and JavaScript files.
FastAPI Backend: You create a FastAPI application that serves as your API. Its job is to handle dynamic requests, such as:
- Fetching data from a database.
- Handling user authentication.
- Processing form submissions.
- Providing data to the frontend for things like a search bar or a live chart.
Serving the Static Assets: This is where the two parts connect. You configure your FastAPI app to act as a web server for the static files generated by the SSG. FastAPI’s
StaticFilesclass is the perfect tool for this.
from fastapi import FastAPI
from fastapi.staticfiles import StaticFiles

app = FastAPI()

# Mount the directory where your SSG's build output is located.
# For Astro, this is typically the 'dist' folder.
app.mount("/", StaticFiles(directory="dist", html=True), name="static")

# Your API endpoints live here, separate from the static content.
@app.get("/api/items")
async def get_items():
    # This endpoint could fetch data from a database
    return [{"id": 1, "name": "Item A"}, {"id": 2, "name": "Item B"}]
Why this approach is common and powerful:
- Performance: The statically generated pages load extremely fast because the server doesn’t have to do any processing for the initial page load. It’s just sending a pre-made HTML file.
- Decoupling: Your frontend (the SSG) and backend (FastAPI) are completely separate. This allows different teams to work on each part independently and lets you swap out one technology for another without affecting the entire stack.
- Scalability: Since the SSG output is static, it can be served from a simple web server or a CDN (Content Delivery Network), which is highly scalable and cost-effective. The FastAPI backend only needs to handle the dynamic API requests, reducing the load on your server.
- Flexibility: You get the best of both worlds—the speed and security of a static site with the power of a dynamic, robust backend for complex features.
Yes, an application combining a static site generator (SSG) like Astro with a backend API (FastAPI or Flask) will be significantly faster for the initial page load than a traditional Flask or Django app that renders every page on the server.
The performance difference comes down to a core architectural distinction:
Static Site Generation (SSG) + API: In this model, the majority of your web pages are pre-built into simple, static HTML, CSS, and JavaScript files. When a user visits your site, their browser gets these files instantly from a CDN (Content Delivery Network). There’s no server-side processing, database queries, or template rendering happening on the fly. This makes the initial page load nearly instantaneous. The Python backend (FastAPI/Flask) is only used for dynamic tasks, like fetching data for a chart or handling a form submission, which happens after the initial page has already loaded.
Traditional Flask/Django App: In this model, every time a user requests a page, the server has to:
- Receive the request.
- Process it using Python code.
- Potentially query a database.
- Render an HTML template with the data.
- Send the finished HTML to the user’s browser.
This entire process adds latency, making the Time to First Byte (TTFB) much slower compared to an SSG. For content-heavy sites like blogs or documentation, this difference is substantial.
The use of an SSG essentially shifts the “heavy lifting” of rendering pages from every user request to a one-time build process. You get the best of both worlds: lightning-fast static pages for content and a powerful dynamic backend for interactive features.
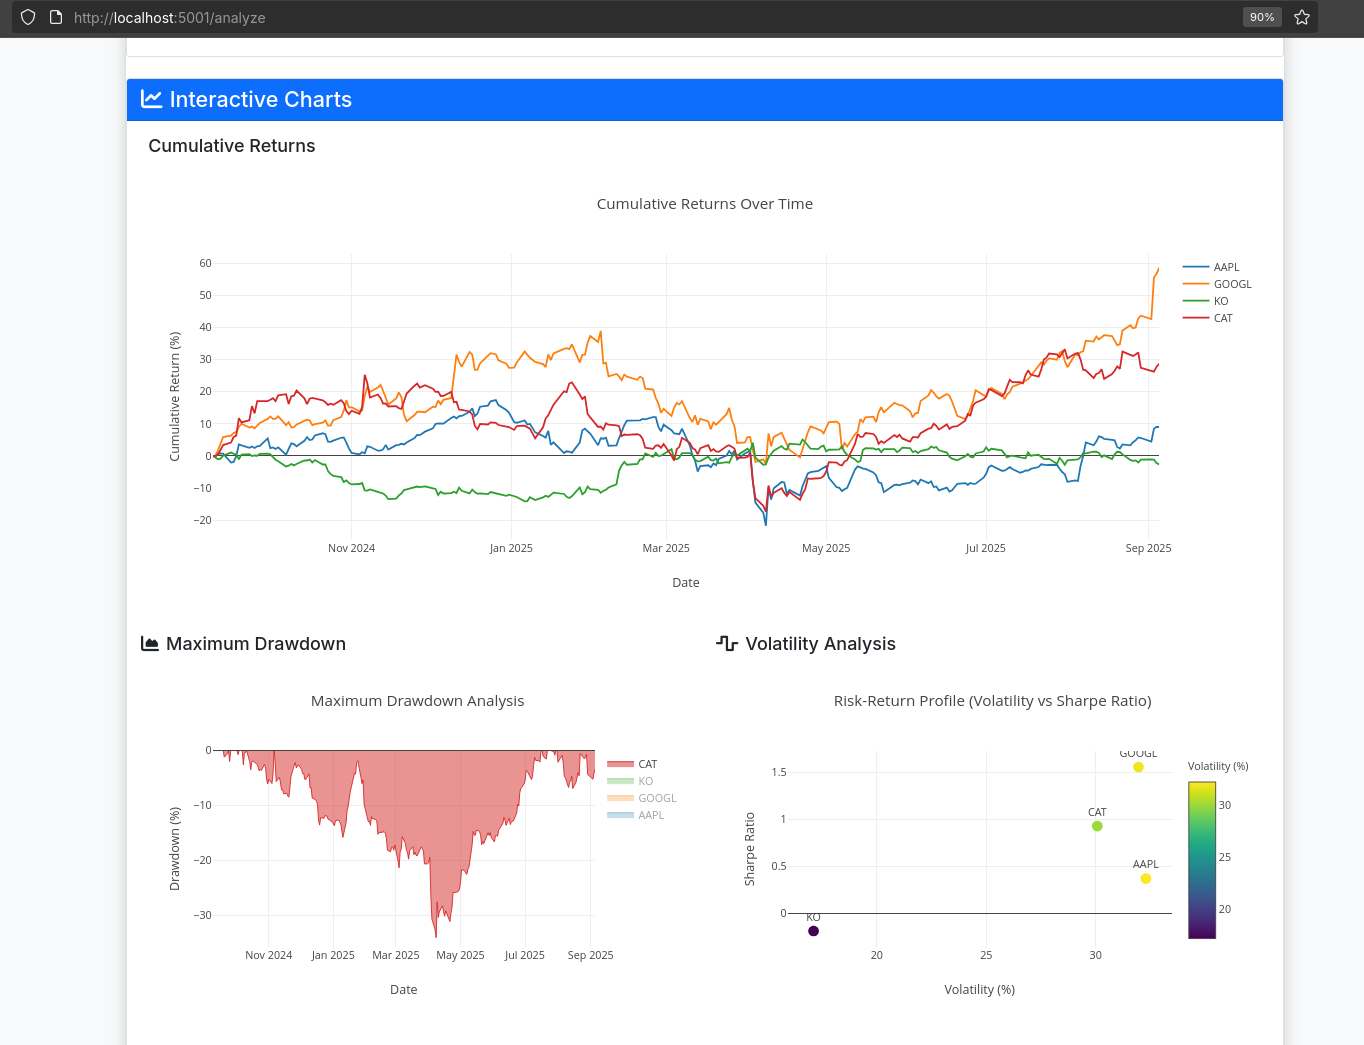
Some people claim that Django+Astro can work together with some fwk like Djazztro
But I can see that FastAPI x ChartJS works perfectly: It will be a next step to bring such cool plot with dinamic data to astro SSG, on another post
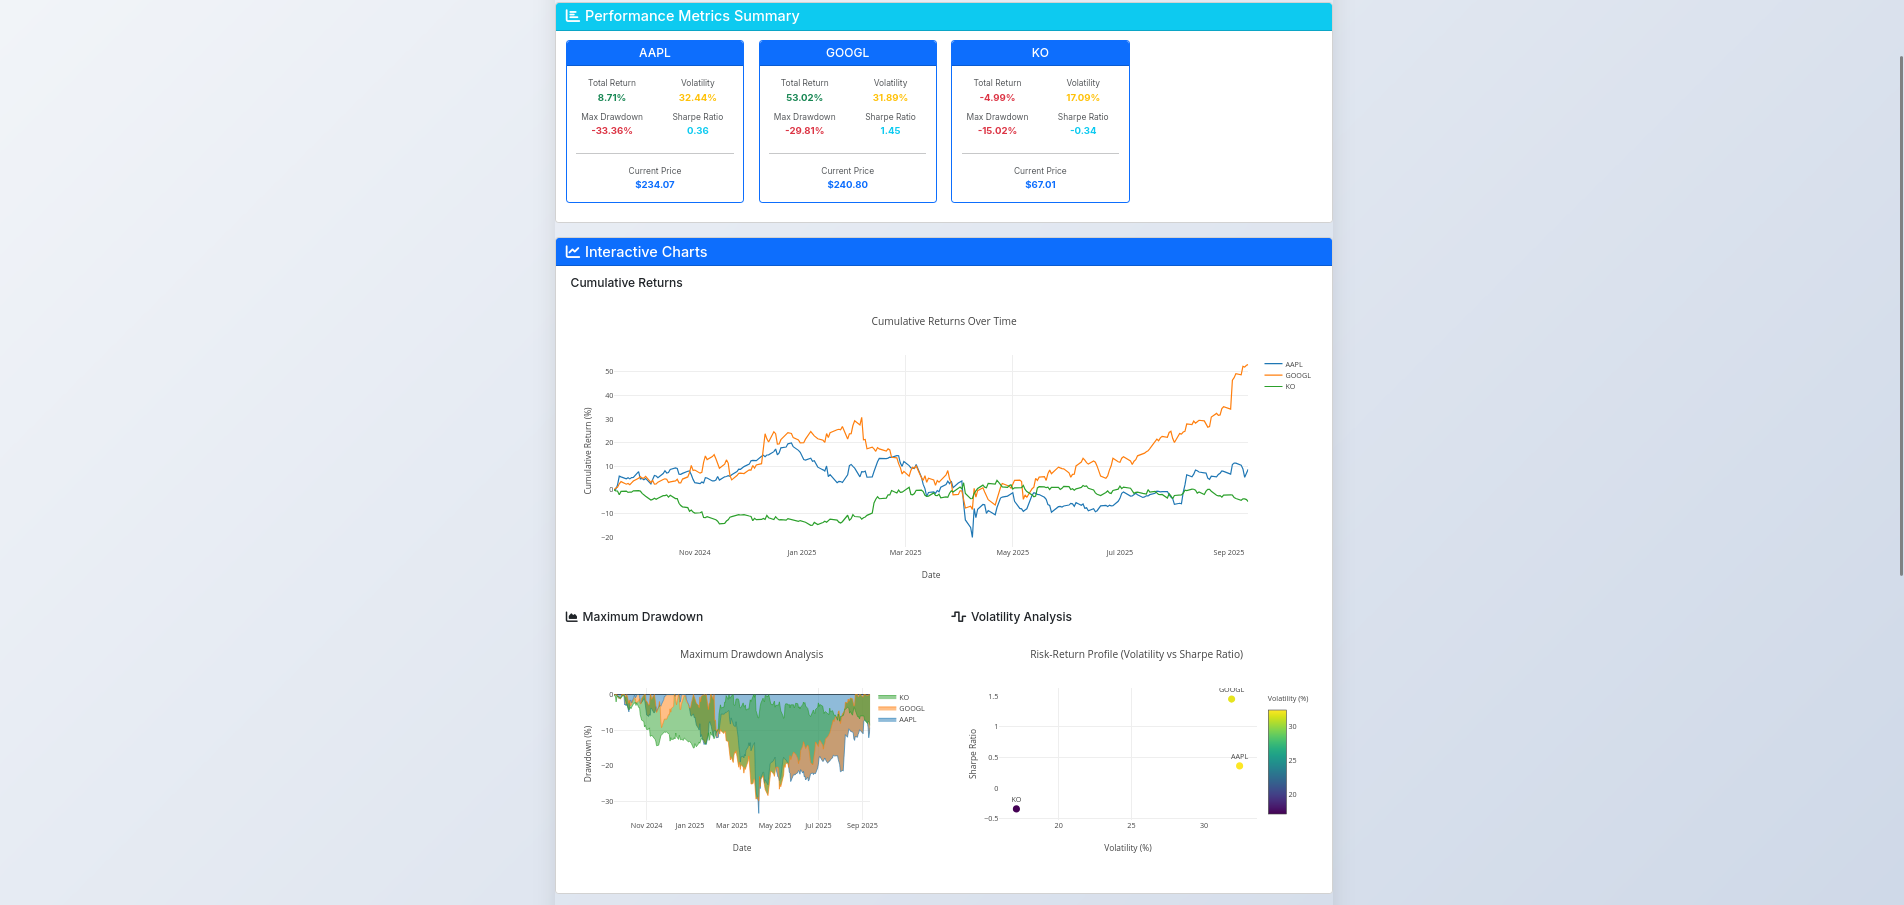
now can you make a quick webapp based on the FastAPI that we have, that will allow to select one of the stocks we have available inside sqlite (it will have a dropdown showing all the values we have already inside)

Once one is selected, it will bring all the data as per selected time range on the slider (by default, it will be max range as per availability on that sqlite table of the stock)

Then, the information will be displayed on a chartJS graph

the UI has to look modern and with cool gradients

you can create it the related UI files at ui-for-fastapi

and the main app that ill run has to be in main and be called app-fastapi-ui.py
Testing Firebase Auth
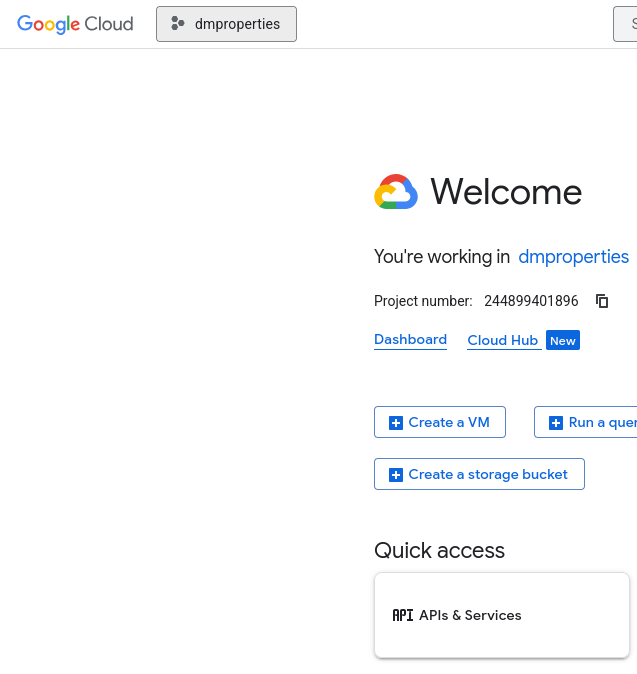
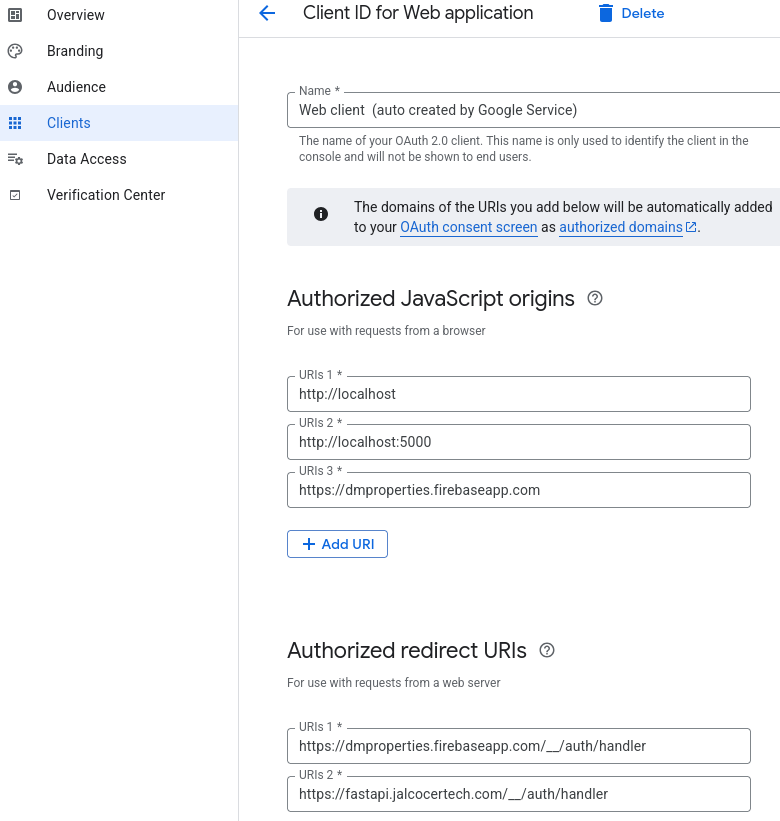
EDIT FROM THE FUTURE: Just coming from the firebase 101 post to try the FastAPI + Firebase Auth Setup here
can you document in a ./ui-for-fastapi.readme the technology used and if any frameworks were applied for the UI?

Also, add that by default, 1/10 of the total date range on the table for the stock is selected

Create the Dockerfile.fastapi-ui and related docker-compose.fastapi-ui.yml to conteinerize the setup

One small details to fix:Lates date should be the most recent date of the table (and the default values have to be visible on the selectable date as well)


Then: Can we think about bringing firebase social sign in signup authentication to this setup?

There will be a env variable called `FIREBASE_ENABLED` true or false

If its false, we keep the setup as it is,

if it is true, there will be the possibility to have below the Statistics a social signin and signup button with google

Users that are logged in, will be able to see an additional chartjs graph with the max draw down information of the selected stock
they will be able to logout as well

All env variables required for the setup will also be passed to the container

Also create a ./ui-for-fastapi-firebaseauth.md that explain from where and how to get googles artifacts to get the auth working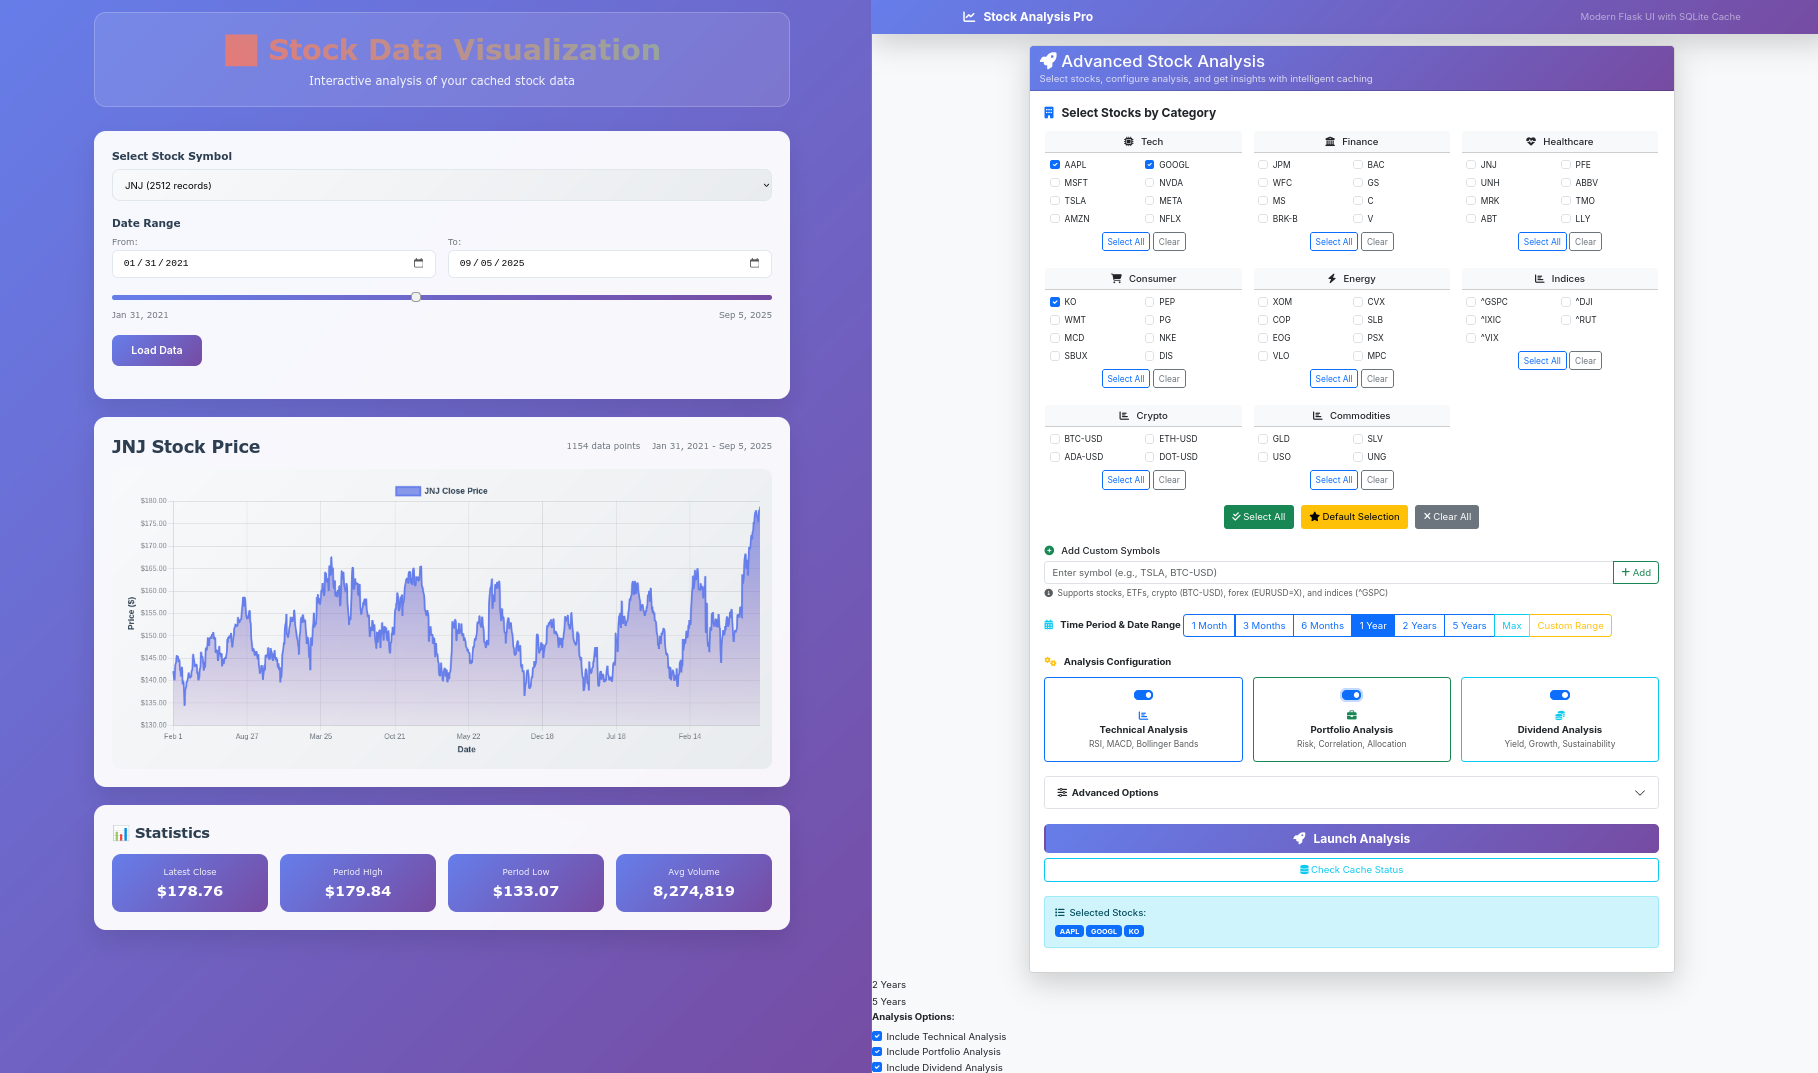
docker compose -f docker-compose.fastapi-ui.yml up --build -d
#docker network connect cloudflared_tunnel py-stonks-fastapi-ui #network -> container name
#docker inspect py-stonks-fastapi-ui --format '{{json .NetworkSettings.Networks}}' | jq
docker exec py-stonks-fastapi-ui env | grep FIREBASE
docker logs py-stonks-fastapi-ui --tail 50localhost out of the box. Make sure to configure custom domains properly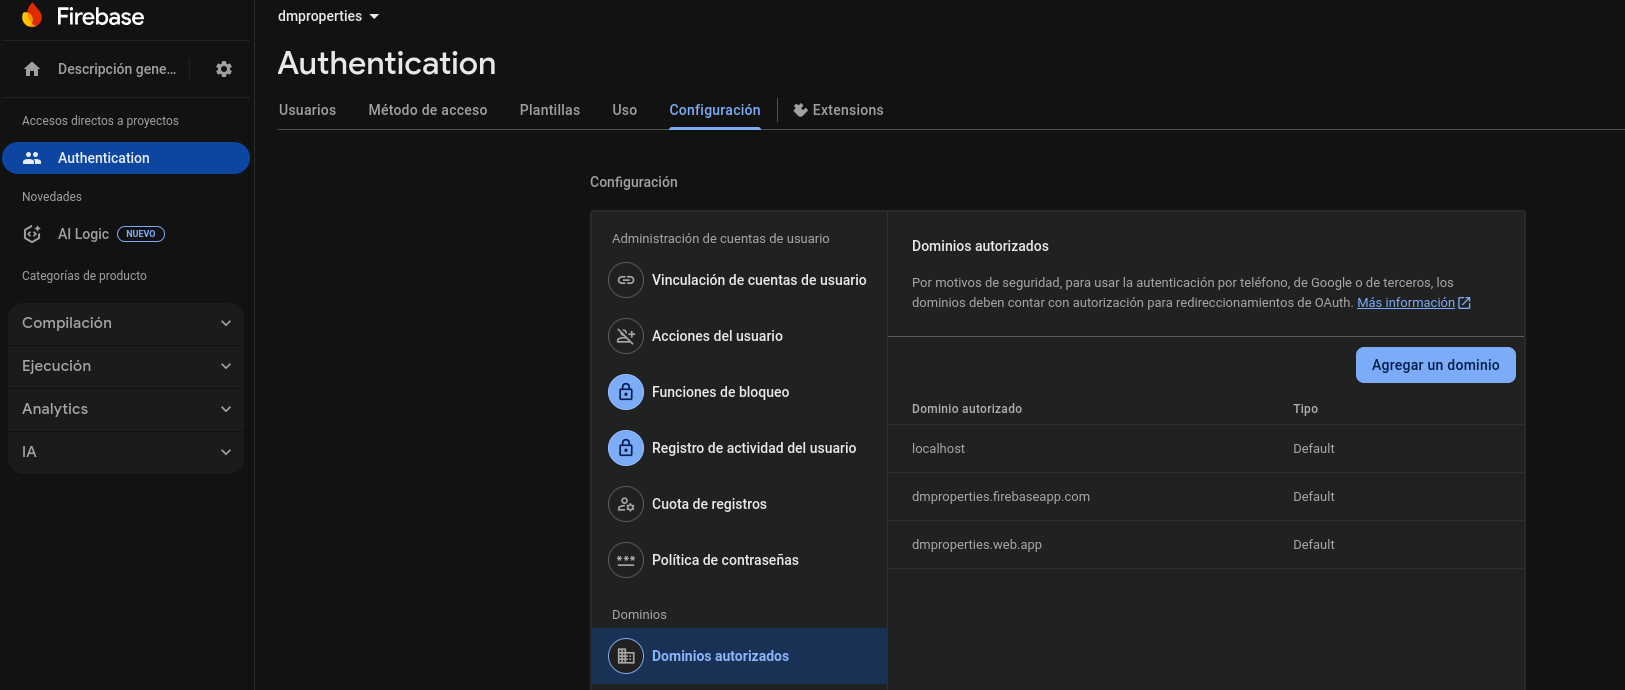
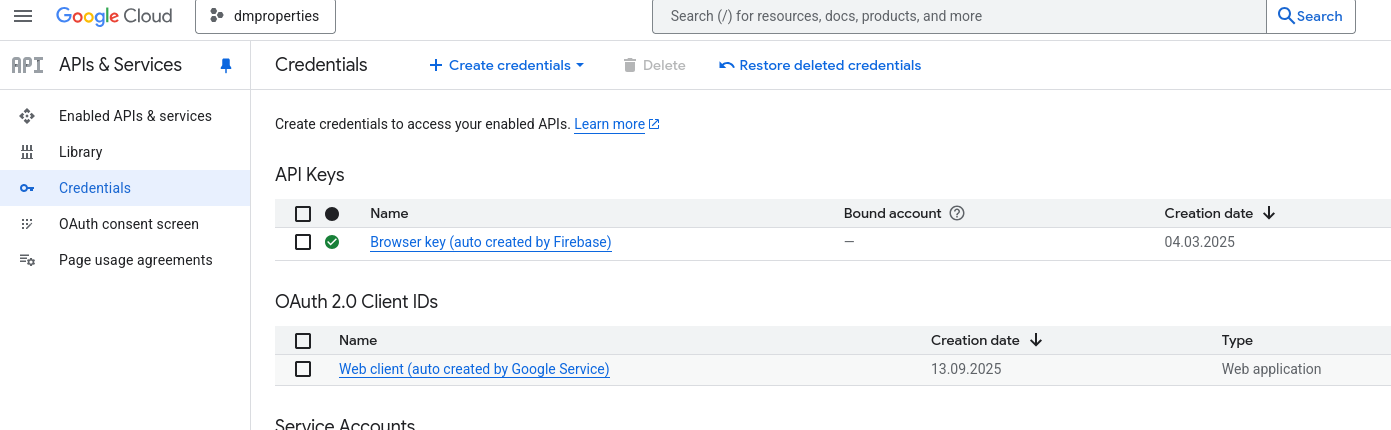
- https://github.com/JAlcocerT/py-stonks/blob/main/ui-for-fastapi-firebaseauth.md
- https://github.com/JAlcocerT/py-stonks/blob/main/docker-compose.fastapi-ui.yml
With FastAPI…..
Even some way for people to create financial data driven animations for themselves.
Could this be a way to reduce the brolosophy on the internet? Who knows
Or get an ebook that gets updated. Or, or or.
Ssounds like a well defined core offer? Whatever…
Creating the CSR driven calculators was kind of easy.
Each of them is having its cool free icon:
npm run dev -- --host 0.0.0.0 --port 4321 #http://192.168.1.11:4321/On Demand Data Animations
As per the learnings of this summer with the DataInMotion repo for matplotlib animations:
- https://github.com/JAlcocerT/DataInMotion/blob/libreportfolio/animate_sequential_compare_price_evolution_flex_custom.py
- https://github.com/JAlcocerT/DataInMotion/blob/main/OpenAI-Audio/openai-tts.py
As well as animations with matplotlib:
 Animations as a Code | PostData In Motion Repo
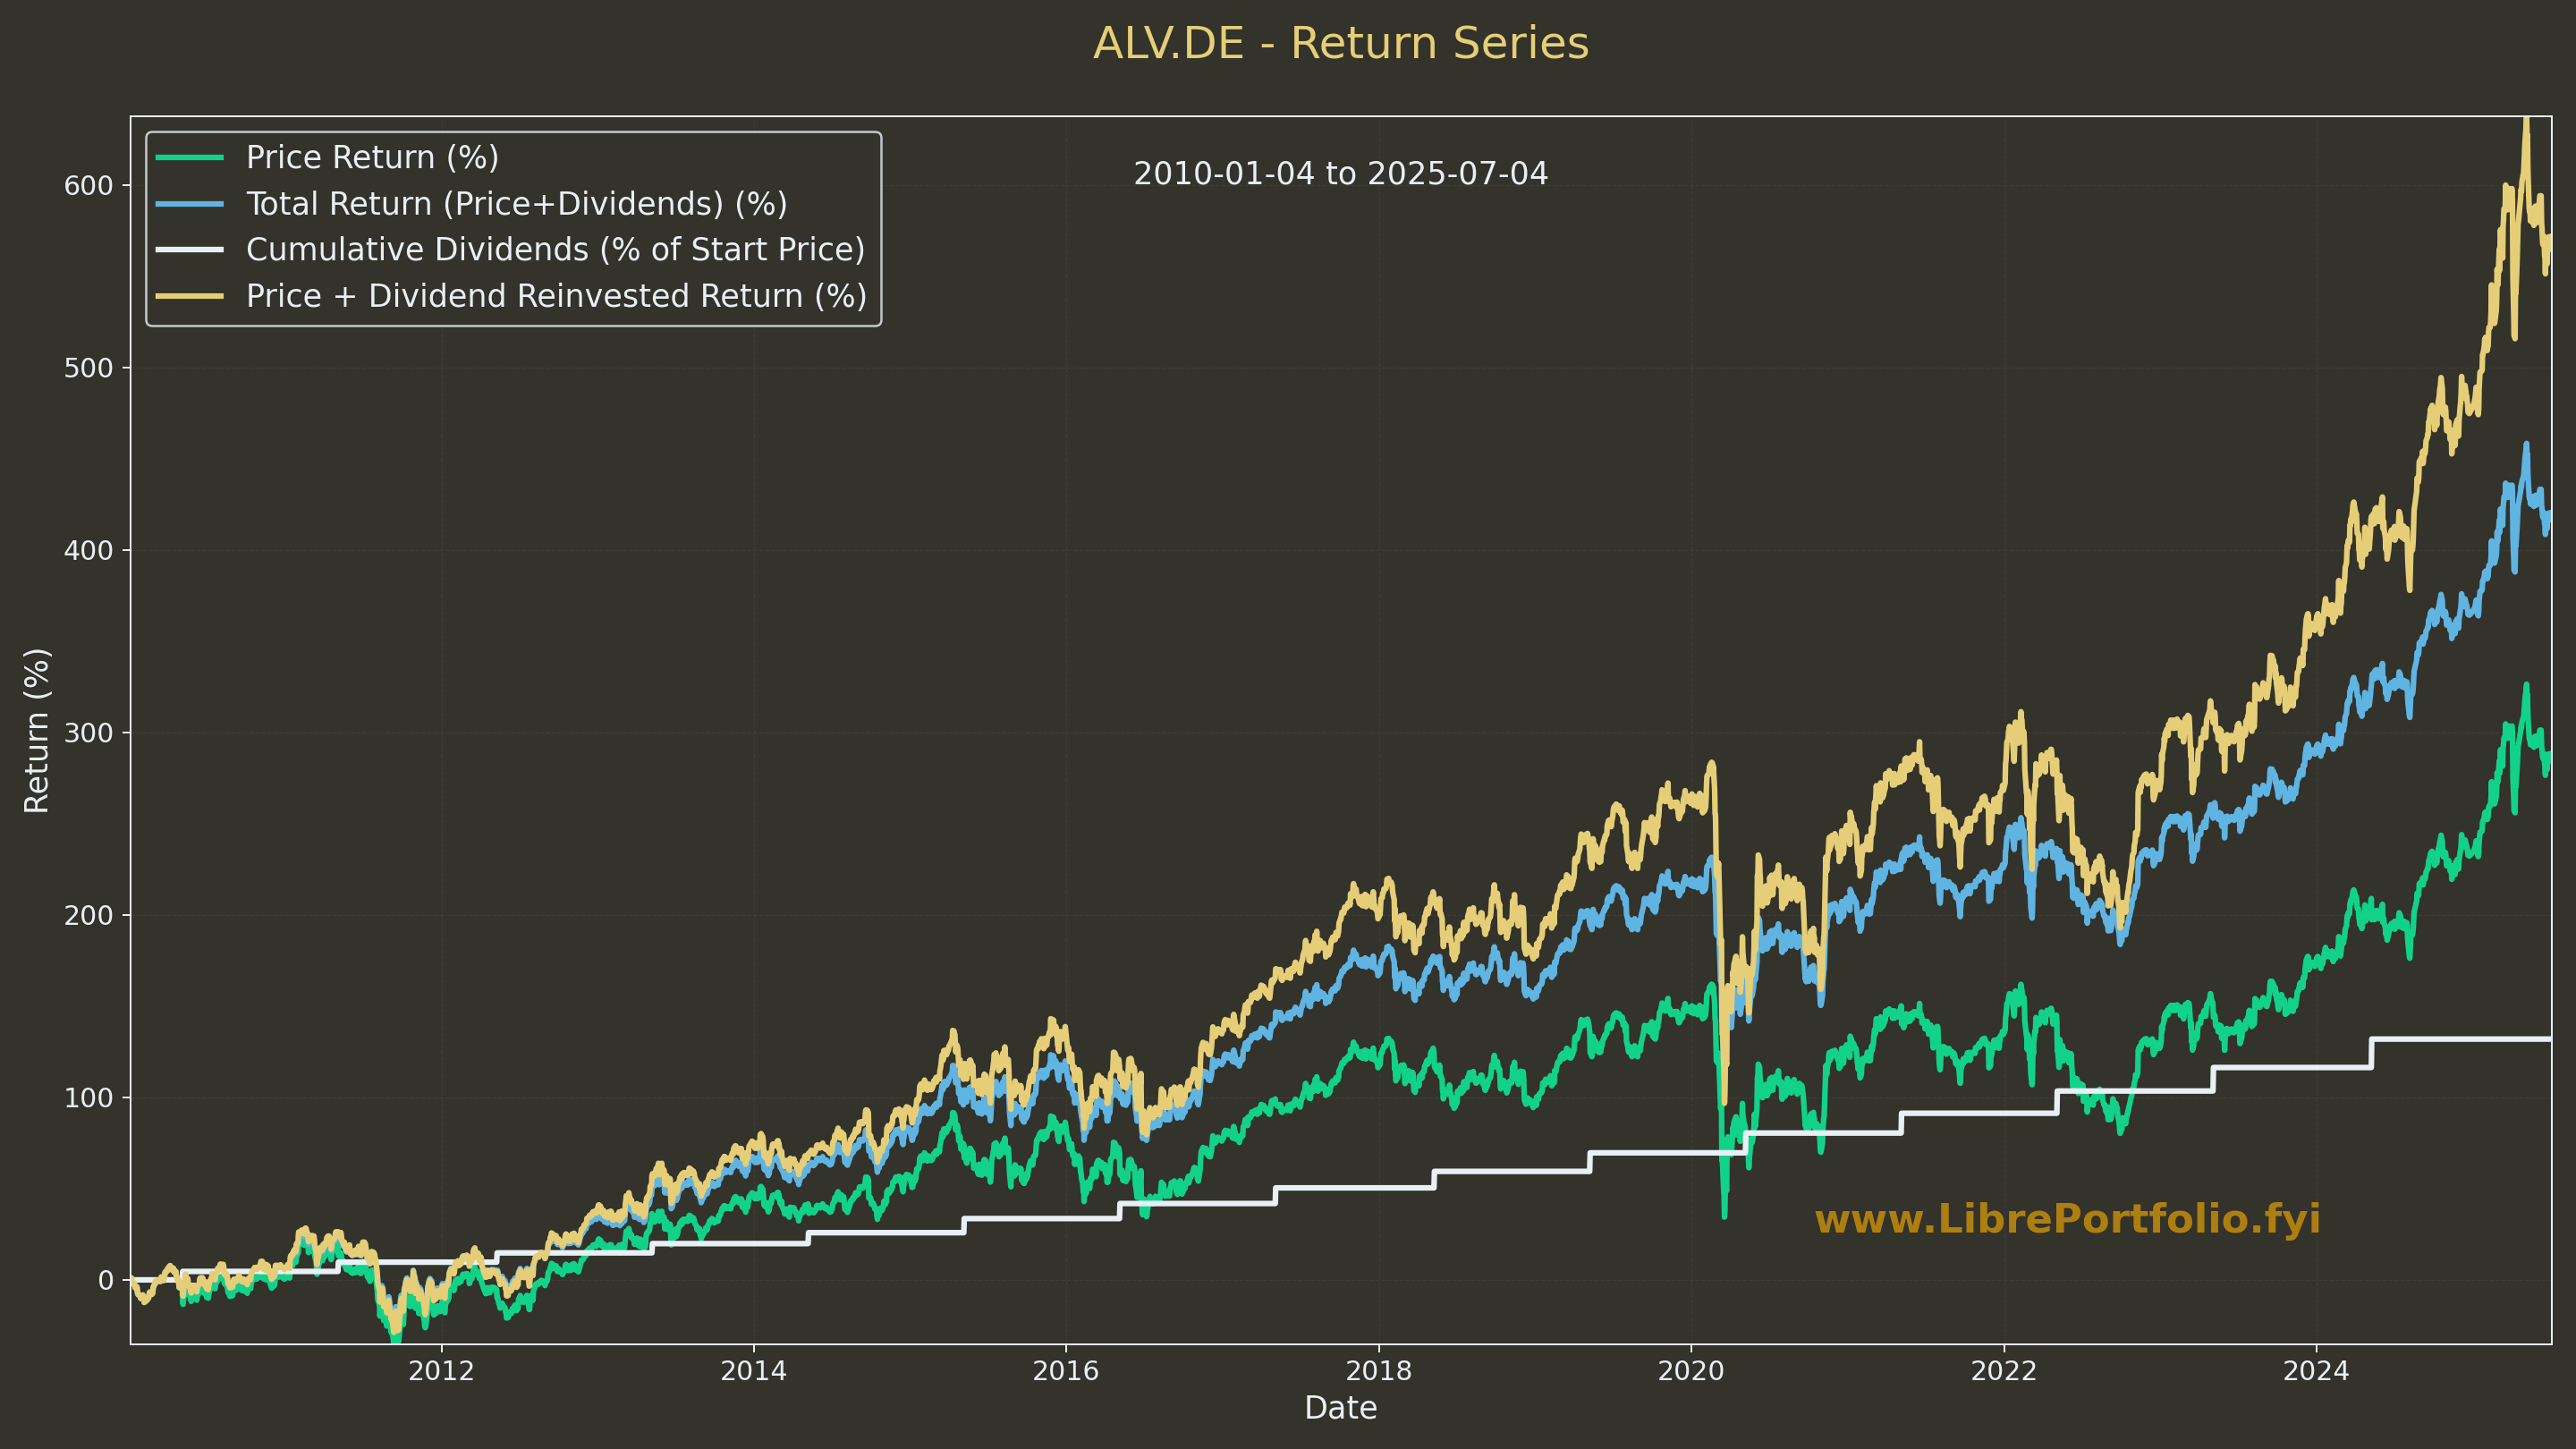
#git clone https://github.com/JAlcocerT/DataInMotion.sqlite + the FastAPI logic above already instead of yfinance –To force me maintaining the projectJust within the ./z-eda-yfinance, I used the good structure to create cool summaries for stocks:
!uv run app-fastapi.py --port=8045And execute the notebooks (from -200.ipynb onwards).
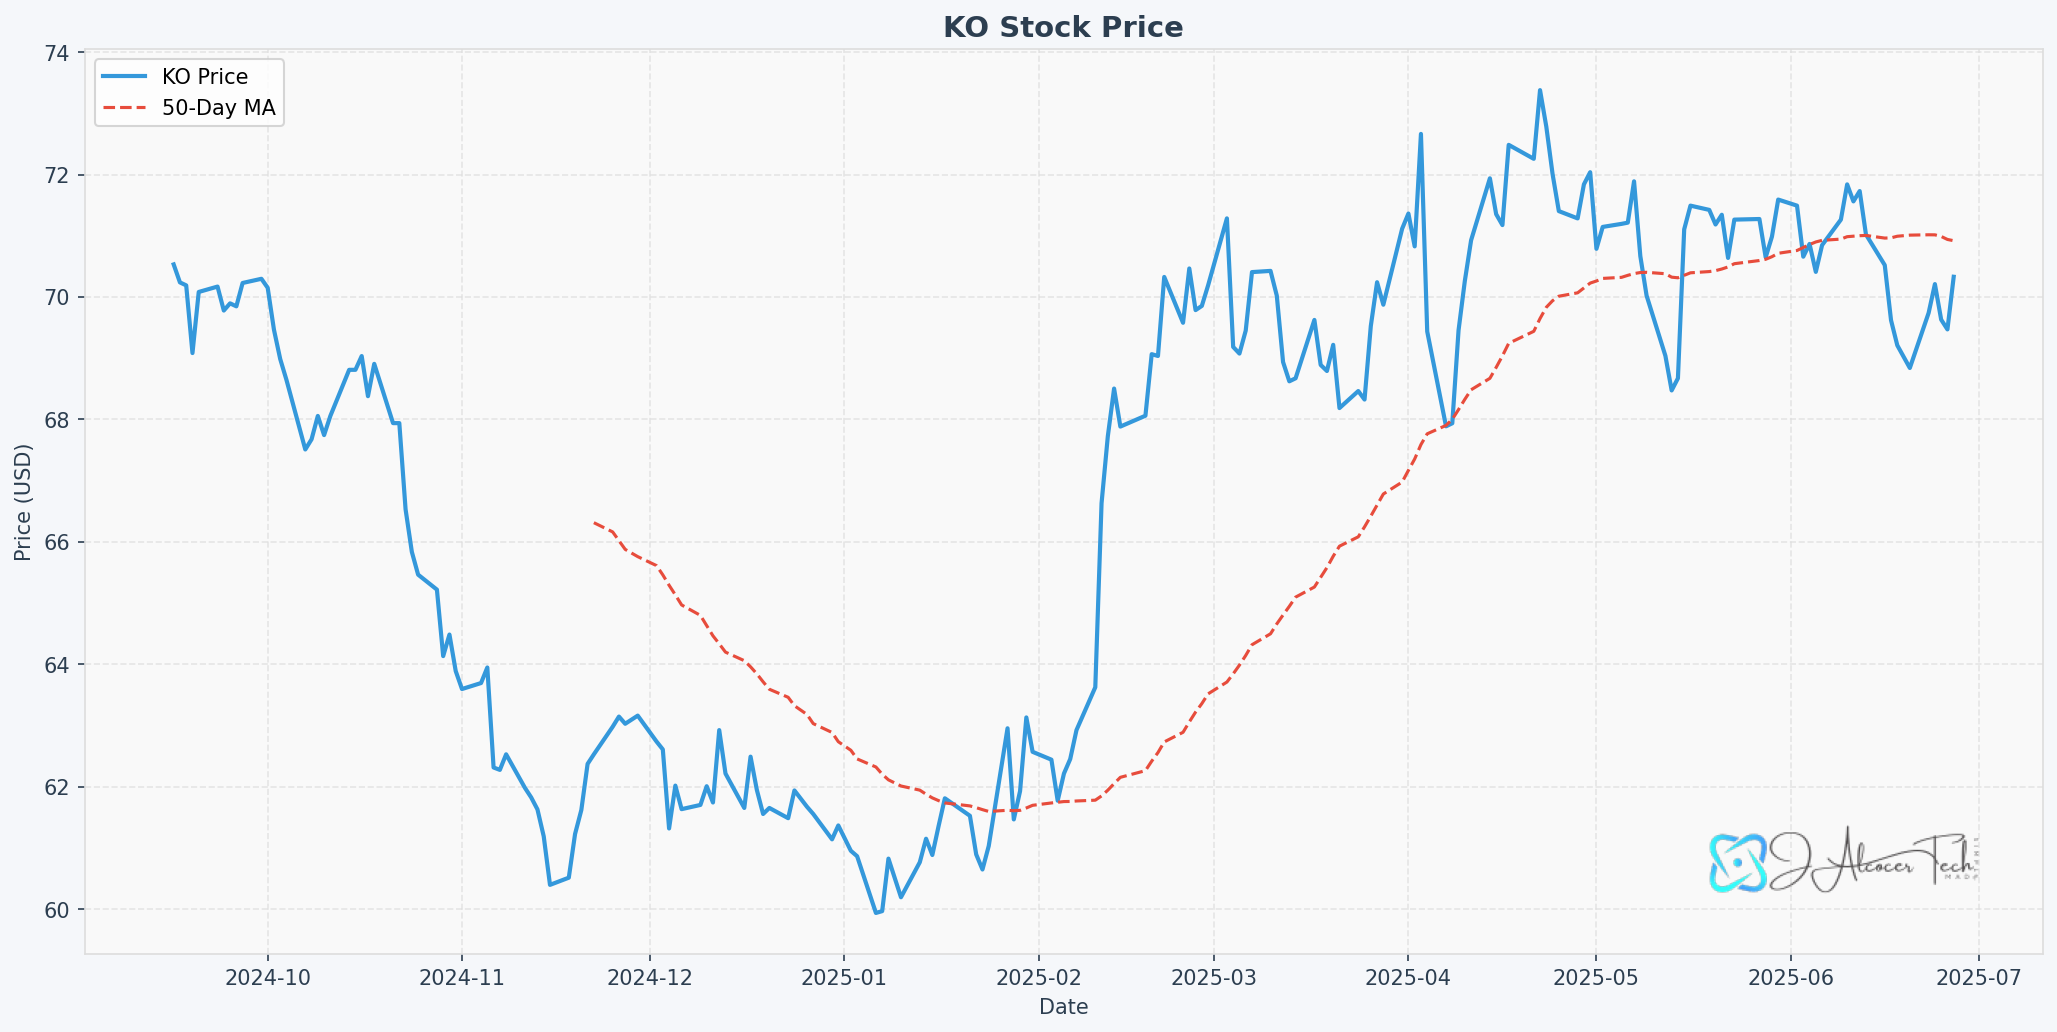
From yfinance-203.ipynb we can add custom colors: https://it-tools.tech/color-converter
From -204, you bring your own logos to the images:
FAQ
Getting to work streamlit with Pocketbase has been a thing and its all thanks to these scripts 🐍
In fact, I used that same PB users collection to test how to authenticate people while keeping things static with cf workers on this post:
- The result was: https://fast-payroll-theme.pages.dev/
And now we are just using the same collection for this:
What is Maximum Drawdown (MDD)?
A stock drawdown is a measure of the decline in the value of an investment (a single stock, a portfolio, or a fund) from a recent peak to a subsequent trough. It is typically expressed as a percentage.
The concept is to quantify the “pain” or potential loss an investor would have experienced if they had bought at the highest point and watched their investment fall before it recovered. It’s a key metric for understanding and managing risk.
The specific metric you’re looking for, which tells you the worst moment to have bought and how far down it went, is called the Maximum Drawdown (MDD).
Maximum Drawdown is the largest peak-to-trough decline over a specified period.
It represents the worst-case scenario for an investor who bought at the worst possible time (the peak) and held until the lowest point (the trough) before a new peak was reached.
How is Maximum Drawdown Calculated?
The formula for Maximum Drawdown is:
$$MDD = \frac{(P - T)}{P} \times 100$$
Where:
- P = The peak value of the investment during the period.
- T = The lowest value (trough) that occurred after the peak but before a new peak was reached.
For example, if a stock’s price history for a given year looks like this:
- It rises to a peak of $100.
- It then falls to $70.
- It then recovers and eventually rises to $120.
The peak is $100, and the trough is $70. The new peak ($120) doesn’t factor into this specific drawdown calculation.
Using the formula: $$MDD = \frac{($100 - $70)}{$100} \times 100 = \frac{$30}{$100} \times 100 = 30%$$
In this example, the maximum drawdown is 30%. This means that for a given period, the most you would have lost from a single peak was 30%.
Why is Maximum Drawdown Important?
- Risk Assessment: It’s a crucial measure of an investment’s downside risk and volatility. A high MDD indicates a more volatile and risky investment.
- Strategy Evaluation: Investors and fund managers use MDD to compare the risk of different investment strategies. A strategy with lower MDD is often preferred by risk-averse investors, even if another strategy had higher returns.
- Investor Psychology: Knowing the MDD of an investment can help you prepare for the potential emotional and financial impact of a significant decline. It provides a historical context for how bad a downturn could get.
Other metrics for Risk Assesment
There are several other well-known metrics used to evaluate investment risk and performance, often in conjunction with drawdown.
While Maximum Drawdown focuses on the absolute worst-case historical loss from a peak, many other metrics consider risk from different angles, often adjusting returns for the risk taken.
Here are some of the most common ones:
1. Sharpe Ratio
The Sharpe Ratio is one of the most widely used metrics for calculating risk-adjusted return. It helps you understand the return of an investment compared to its risk.
What it tells you: It measures the excess return an investment earns for each unit of total risk (volatility).
Formula:
$$Sharpe\ Ratio = \frac{R_p - R_f}{\sigma_p}$$
Where: * $R_p$ = Return of the portfolio or asset. * $R_f$ = Risk-free rate of return (e.g., the return on a U.S. Treasury bond). * $\sigma_p$ = Standard deviation of the portfolio’s excess return. Standard deviation is a measure of volatility.
- Interpretation: A higher Sharpe Ratio is better. It means you are getting more return for the amount of volatility (risk) you are taking on. A negative Sharpe Ratio means the investment has underperformed the risk-free rate.
2. Sortino Ratio
The Sortino Ratio is a refinement of the Sharpe Ratio that addresses a key limitation: the Sharpe Ratio penalizes both positive and negative volatility.
Most investors, however, are only concerned with downside volatility (losing money).
- What it tells you: It measures the excess return an investment earns for each unit of downside risk.
- Formula:
$$Sortino\ Ratio = \frac{R_p - T}{\sigma_d}$$
Where:
$R_p$ = Return of the portfolio or asset.
$T$ = Target or required rate of return (often the risk-free rate).
$\sigma_d$ = Downside deviation. This is a measure of volatility that only considers returns below the target rate.
Interpretation: A higher Sortino Ratio is better. It is often a more useful metric for strategies that might have high positive volatility, as it focuses specifically on the risk of losses.
3. Beta ($β$)
Beta is a measure of an investment’s volatility in relation to the overall market (usually represented by an index like the S&P 500).
- What it tells you: It quantifies the systematic risk of a stock.
- A Beta of 1.0 means the stock’s price moves in lockstep with the market.
- A Beta greater than 1.0 means the stock is more volatile than the market. For example, a beta of 1.5 suggests the stock will move 1.5% for every 1% move in the market.
- A Beta less than 1.0 means the stock is less volatile than the market.
- Interpretation: Beta helps you understand how an investment will behave within a diversified portfolio. High-beta stocks are often considered more aggressive and riskier, while low-beta stocks are seen as more defensive.
4. Calmar Ratio
The Calmar Ratio is very similar to the Sharpe and Sortino Ratios but uses Maximum Drawdown as its measure of risk.
- What it tells you: It measures the return of an investment in relation to its maximum historical loss.
- Formula:
$$Calmar\ Ratio = \frac{R_p - R_f}{Maximum\ Drawdown}$$
Where:
- $R_p$ = Compounded Annual Growth Rate (CAGR) of the portfolio’s return.
- $R_f$ = Risk-free rate.
- $Maximum\ Drawdown$ = The value of the MDD (as a positive number).
- Interpretation: A higher Calmar Ratio is better. It provides a straightforward way to compare the long-term returns of a strategy against the largest single loss an investor would have endured.
These metrics, along with others like the Ulcer Index and Value at Risk (VaR), provide a comprehensive toolkit for investors to assess risk from multiple perspectives.
Each metric has its own strengths and weaknesses, so it’s often best to use a combination of them to get a complete picture of an investment’s risk-reward profile.